Semantic Audio Tools for Radio Production
Chris Baume / PhD thesis / April 2018
![]()

Abstract
Radio production is a creative pursuit that uses sound to inform, educate and entertain an audience. Radio producers use audio editing tools to visually select, re-arrange and assemble sound recordings into programmes. However, current tools represent audio using waveform visualizations that display limited information about the sound.
Semantic audio analysis can be used to extract useful information from audio recordings, including when people are speaking and what they are saying. This thesis investigates how such information can be applied to create semantic audio tools that improve the radio production process.
An initial ethnographic study of radio production at the BBC reveals that producers use textual representations and paper transcripts to interact with audio, and waveforms to edit programmes. Based on these findings, three methods for improving radio production are developed and evaluated, which form the primary contribution of this thesis.
Audio visualizations can be enhanced by mapping semantic audio features to colour, but this approach had not been formally tested. We show that with an enhanced audio waveform, a typical radio production task can be completed faster, with less effort and with greater accuracy than a normal waveform.
Speech recordings can be represented and edited using transcripts, but this approach had not been formally evaluated for radio production. By developing and testing a semantic speech editor, we show that automatically-generated transcripts can be used to semantically edit speech in a professional radio production context, and identify requirements for annotation, collaboration, portability and listening.
Finally, we present a novel approach for editing audio on paper that combines semantic speech editing with a digital pen interface. Through a user study with radio producers, we compare the relative benefits of semantic speech editing using paper and screen interfaces. We find that paper is better for simple edits of familiar audio with accurate transcripts.
Statement of originality
This thesis and the work to which it refers are the results of my own efforts. Any ideas, data, images or text resulting from the work of others (whether published or unpublished) are fully identified as such within the work and attributed to their originator in the text, bibliography or in footnotes. This thesis has not been submitted in whole or in part for any other academic degree or professional qualification. I agree that the University has the right to submit my work to the plagiarism detection service TurnitinUK for originality checks. Whether or not drafts have been so-assessed, the University reserves the right to require an electronic version of the final document (as submitted) for assessment as above.
Acknowledgements
My foremost thanks go to my supervisor, Prof. Mark Plumbley, for his enthusiasm, encouragement, wisdom and guidance over the years. Huge thanks also to my co-supervisors: Dr. Nick Bryan-Kinns, Dr. Janko Ćalić and Prof. David Frohlich, for their invaluable suggestions, feedback and advice, and for helping me navigate an unfamiliar field of research.
I have been extremely privileged to have been able to undertake this research as part of my employment at the BBC. My heartfelt thanks go out to Prof. Graham Thomas, Dr. Frank Melchior, Chris Pike and Samantha Chadwick for giving me this rare opportunity, and for their steadfast support throughout the process. Many thanks to my colleagues in the BBC R&D Audio Team for their patience, support and help with proofreading, but also for being brilliant people to work with.
This work was only made possible through the involvement of colleagues from BBC Radio, who volunteered their time despite their demanding workload. My sincere thanks go to all of the radio producers who took the time to participate in the user studies and contribute to the design of the interfaces. Thanks also to Deborah Cohen, Hugh Levinson and John Goudie for allowing me access to their teams, and to Jonathan Glover his advocacy and encouragement.
Thanks to Liam Bowes, Carl Garner and Richard Sargeant from Anoto for their support in the development of the digital pen interface, and to Matt Haynes and Matt Shotton from BBC R&D, whose software formed part of the semantic speech editor.
Finally, I’d personally like to thank my wife, Nancy, for her love, encouragement, patience and belief in me throughout this process. I couldn’t have done it without you.
The work in this thesis was fully funded by the British Broadcasting Corporation as part of the BBC Audio Research Partnership.
Licence
This work is copyright 2018 Chris Baume, and is licensed under the Creative Commons Attribution 4.0 International Licence. To view a copy of this licence, visit http://creativecommons.org/licenses/by/4.0/ or send a letter to Creative Commons, PO Box 1866, Mountain View, CA 94042, USA.


List of Figures
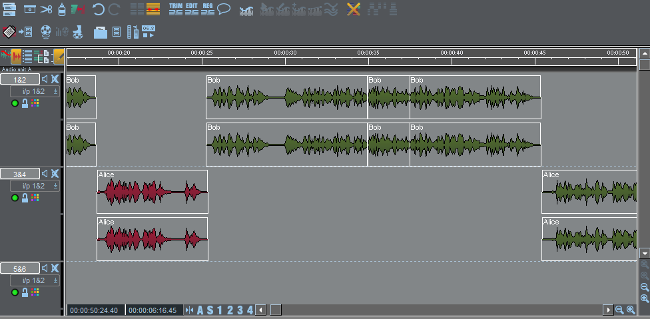
2.1.1.1 User interface of the SADiE digital audio workstation from Prism Sound, which is used at the BBC for radio production.
2.1.2.1.1 Example audio waveforms of speech, demonstrating the effect of zoom on the visibility of frequency information.
2.1.2.2.1 An example audio spectrogram of speech.
2.2.2.2.1 Speaker diarization and recognition interface in the BBC World Service Archive prototype, from Raimond et al. (2014)
2.2.2.3.1 Example ASR transcript.
2.3.1.1 Demonstration of the “bouba/kiki effect” — an example of crossmodal perception.
2.3.2.1.1 Lens view for magnifying an audio waveform at the current playhead position, from Gohlke et al. (2010). Republished with permission.
2.3.2.2.1 An audio waveform colourised by using pseudocolour to map the spectral centroid of the audio to a rainbow colour gradient.
2.3.2.2.2 False colour audio visualization of an episode of the BBC radio programme “From Our Own Correspondent”, from (Mason, Evans, and Sheikh 2007).
2.3.2.2.3 Comparison of a normal spectrogram (top) and a saliency-maximised spectrogram (bottom), from Lin et al. (2013). Republished with permission.
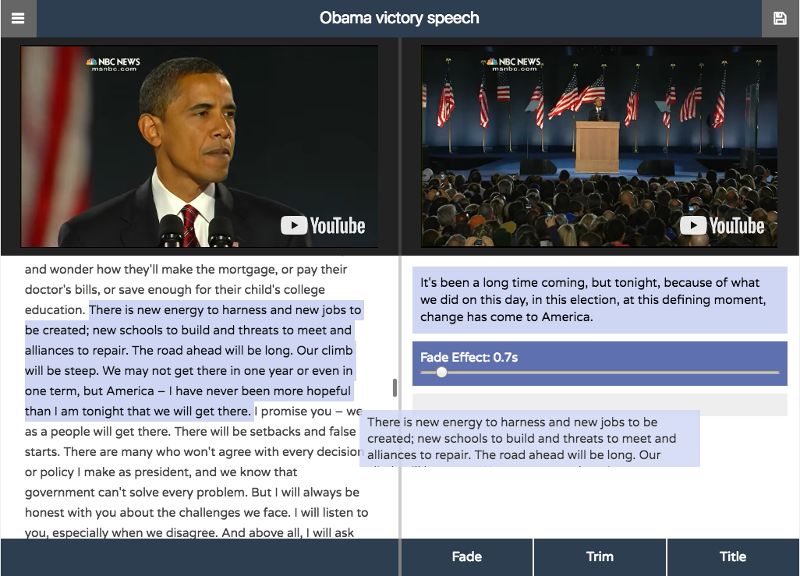
2.4.3.1 User interface of a semantic speech editor for creating “audio stories”, from Rubin et al. (2013). Republished with permission.
2.4.4.1 User interface of Hyperaudio Pad — a semantic speech editor for video, from Boas (2011). Drag-and-drop is used to select clips from the left transcript and arrange them on the right transcript.
3.2.1.2.1 The newsroom in BBC New Broadcasting House. Image source: BBC.
3.2.1.2.2 Physical layout of Radio Summaries in the BBC newsroom.
3.2.1.2.3 Desk of the Radio Summaries Assistant Editor. The switching interface controls the output of the monitor and headphones.
3.2.1.2.4 User interface for Electronic News Production System (ENPS). The Media Object Server (MOS) plugin is used to find and edit audio clips in the dira! radio production system.
3.2.1.2.5 Arrivals board in BBC newsroom, showing the ID number, name and arrival time of each audio clip. “VCS” is the colloquial name for the dira! radio production system, as it is made by a company that used to be called VCS.
3.2.1.2.6 Operational sequence diagram of news summaries production, partitioned by role and location.
3.2.2.2.1 Physical layout of the drama studio and cubicle.
3.2.2.2.2 Cubicle of studio 60A, showing the view of the Panel SM into the studio.
3.2.2.2.3 Radio drama edit suite.
3.2.2.3.1 Operational sequence diagram of radio drama recording, partitioned by role and location.
3.2.2.3.2 An annotated drama script page.
3.2.2.3.3 Operational sequence diagram of radio drama editing, partitioned by role and location.
3.2.3.3.1 Operational sequence diagram of radio documentary production, partitioned by role and location.
4.1.3.1 Screenshot of the user interface used to display the audio visualizations, complete the segmentation task and measure the user’s performance.
4.1.3.2 The audio visualization conditions that were evaluated.
4.2.1 Rejected responses by audio clip.
4.2.1.1 \(p\)-values of pairwise comparisons for the performance metrics. Statistically significant differences are shaded.
4.2.2 Participant demographics.
4.2.2.1 Mean task load index values with 95% confidence intervals. Lower values represent better performance.
4.2.2.2 Condition preferences of participants.
5.2.5.1 User interface of Dialogger, with highlighted features.
5.4.2.3.1 Printed transcript that has been highlighted by P2.
5.4.3.1.1 Time taken to complete the task for each condition, compared to the original audio length.
5.5.6.1 User interface of the Descript semantic speech editor, a commercial semantic speech editing system developed independently of our research.
6.2.1.1 Design of our paper mock-up.
6.3.1.1 Layout of the paper interface.
6.3.1.2 Example of the paper interface system, with freehand annotations that demonstrate its use.
6.3.1.3 Flow diagram of PaperClip, showing the integration between the paper and screen interfaces, flowing from left to right.
6.3.2.1 User interface of the screen-based semantic speech editor.
6.3.2.2 Close-up of the edits sidebar of the screen-based semantic speech editor, showing a button to export audio, and a dropdown menu with the option to download a PDF.
6.5.1.1 Mean average scores for usefulness and usability. There is no statistically significant difference between the scores.
6.5.2.5.1 Annotations made on paper in the margin by P5. The content is segmented using horizontal lines and labels in the margin. The middle segment is marked as not needed using a diagonal line.
A.1.1.1 Flow diagram of the Dialogger system. Excluded components are shaded.
A.2.1.1 Conceptual diagram of the Vampeyer visualization framework
A.3.1 Example user interface showing BeatMap in use.
List of Tables
2.3.1.1 Audio-visual mappings supported by strong evidence, from Spence (2011).
4.1.5.1 Descriptions of the radio programmes used as the source of the audio clips.
4.2.1.1 \(p\)-values of pairwise comparisons for the performance metrics. Statistically significant differences are shaded.
4.2.2.1 \(p\)-values of pairwise comparisons for the perceptual metrics. Statistically significant differences are shaded.
4.3.1 Summary of confirmed findings for each hypothesis, with \(p<.05\).
5.4.1 Topics, categories and codes that emerged from analysis of the interviews in Stage 4 and the observation notes from Stages 1, 2 and 3.
6.2.3.1 Natural gestures used by each participant to edit their transcripts.
6.4.1 Evaluation study participant demographics.
6.5.1 Themes, categories and number of codes that resulted from the quantitative analysis of the interviews and observations.
List of abbreviations
| ANOVA | Analysis of Variance |
| AP | Associated Press |
| ASR | Automatic Speech Recognition |
| BBC | British Broadcasting Corporation |
| DAW | Digital Audio Workstation |
| EDL | Edit Decision List |
| ENPS | Electronic News Production System |
| HSD | Honest Significant Difference |
| HSV | Hue Saturation Value |
| IP | Internet Protocol |
| ISDN | Integrated Services Digital Network |
| LER | Low Energy Ratio |
| LSD | Least Significant Difference |
| MFCC | Mel-Frequency Cepstral Coefficient |
| MOS | Media Object Server |
| NPR | National Public Radio |
| RDC | Radio Drama Company |
| RGB | Red Green Blue |
| RMS | Root Mean Square |
| ROT | Recording of Transmission |
| RQDA | R package for Qualitative Data Analysis |
| SM | Studio Manager |
| SMD | Speech Music Discrimination |
| SPSS | Statistical Package for the Social Sciences |
| SUS | Software Usability Scale |
| TLX | Task Load Index |
| WAV | Waveform Audio File Format |
| WER | Word Error Rate |
| ZCR | Zero Crossing Rate |
Ethics
Chapter 3 received ethics approval from the Queen Mary University of London Ethics of Research Committee, under the reference
QMERC1386b.Chapter 4 received ethics approval from the Queen Mary University of London Ethics of Research Committee, under the reference
QMREC1348d.Chapter 5 received a favourable ethical opinion from the University of Surrey Ethics Committee, under the reference
UEC/2015/054/FEPS.Chapter 6 received a favourable ethical opinion from the University of Surrey Ethics Committee, under the reference
UEC/2015/116/FEPS.
A note on writing style
Throughout this thesis, the term “we” is used to refer to the author’s own work. This acknowledges that that the work has been influenced by discussions with supervisors and colleagues, and follows recent trends in academic writing style. At times when a statement represents the sole opinion of the author, or when reader is invited to think alongside, or perhaps disagree with, the author, phrases such as “the author believes” are deliberately used.
1 Introduction
Radio broadcasting is the use of radio waves to transmit sound to a large audience. The first regular radio broadcasts in the UK began in 1922 when a consortium of radio manufacturers formed the BBC (BBC 2015). Almost a century later, radio is still one of the mass media, with 90% of the UK adult population listening to the radio each week for an average of 21 hours (RAJAR 2017). In the UK alone, there are 50 national, 329 local and 251 community radio stations (Office of Communications 2017, pp. 6-127).
Traditionally, radio has been consumed over the airwaves, but the Internet has changed the way audio content is distributed and consumed. On-demand radio allows the audience to listen to a radio programme whenever they like, and podcasting allows audio content to be downloaded as a digital file. Over 200,000 podcasts are available through iTunes (Morgan 2015) and approximately 10% of the UK adult population regularly listen to podcasts (RAJAR and IpsosMori 2017). The distinction between radio content and podcasts is beginning to blur as broadcasters are repurposing some of their speech-based radio output as podcasts (Office of Communications 2017, p. 98).
The British Broadcasting Corporation (BBC) has the largest share of radio listening, and is the most popular source of podcasts, in the UK (Office of Communications 2017, p. 107). The research presented in this thesis was funded by the BBC and conducted during, and as part of, the author’s employment at BBC Research and Development. BBC R&D promotes technological innovation that supports the BBC’s mission to enrich people’s lives with programmes and services that inform, educate and entertain (BBC Charter 2016 art. 15). This is achieved through the research and development of broadcast technology, including for the production and distribution of audio content.
1.1 Motivation
One of the distinguishing characteristics of radio is that it is based exclusively on sound. Although listeners have no visual reference, sound stimulates the imagination and creates pictures in the mind’s eye. Radio is not limited by the size of the screen in the way that television is. Sound design and music can be used to produce scenes for virtually any scenario, which may otherwise be impossible or too expensive to put on screen. As the old adage goes “the pictures are so much better on the radio”.
Humans use sound to communicate through language and music, which can richly convey complex ideas and elicit powerful emotion. Despite this, sound is simply the result of vibration in a medium such as air. As sound is based on vibration, it cannot be “frozen” — it can only exist over a period of time. The temporal nature of sound gives it unique properties that make it both a fascinating and challenging medium to work with.
Unlike pictures, which can be viewed and searched at a glance, sound recordings must be perceived through listening. The time needed to naturally listen to a sound recording is the same as the length of the recording. Reviewing long recordings can therefore take a large amount of time. Sound is also a linear medium that must be played in sequence, which can make it challenging to navigate sound recordings non-linearly.
Radio production is a process of recording, selecting and re-arranging audio content, so it is desirable to be able to efficiently interact with audio. Modern radio production is performed on a computer screen using a digital audio workstation (DAW). DAWs visualize audio by plotting the amplitude of the audio signal over time, known as an audio waveform. Waveforms allow users to interact with the audio spatially rather than temporally, which is thought to be a faster and easier way to navigate audio recordings. Waveforms display some useful information, but are limited in the information they can convey. For example, when viewing a waveform at the right scale, it is often possible for an experienced user to distinguish between speech and music, but it is not usually possible to determine the style of the music, or what is being said.
Semantic audio analysis is the task of deriving meaning from audio. This is achieved by extracting audio features that describe the sound, and mapping these to a human-readable representation, such as categories or words. This research was partly inspired by a conference presentation from Loviscach (2013), who demonstrated several prototypes that used semantic audio analysis to assist the editing of recorded speech. These included visualizing vowels using colour, detecting and highlighting “umm”s, and identifying repetition. These prototypes were developed to assist the navigation and editing of lecture recordings using custom video editing software (J. Loviscach 2011a).
Applying semantic audio analysis or better visualisation techniques to radio production tasks may allow us to produce richer user interfaces that make it easier and faster for producers to create their programmes. We are interested in discovering whether this approach could be used to improve the radio production process, and which techniques work best. As part of this research, we want to understand how these techniques can be applied to the production of radio to make the process more efficient, such as by reducing the time or effort that is needed to produce the programme.
Making radio production more efficient may free up resources that could be spent on producing higher quality content, or used to making financial savings. The BBC spent £471M on radio production in 2016/17 (Office of Communications 2017, p. 111), so even minor improvements to production workflows could result in large savings. We are also interested in making radio production a more enjoyable and creative experience, where producers spend less time on boring, menial tasks and more time on activities that contribute to the quality of the programme output.
Radio production has not been subject to much previous academic research. The author’s position within the BBC gives us extraordinary access to production staff and working environments that would otherwise be inaccessible to most researchers. We view this as a rare opportunity to conduct research that directly involves professional radio producers and takes place within a genuine work environment.
1.2 Aim and scope
The aim of this work is to improve radio production by developing and evaluating methods for interacting with, and manipulating, recorded audio. Our ambition is to apply these methods to make radio production more efficient or to open up new creative possibilities. In Sections 2.6 and 3.5, we formulate the specific research questions that are answered in this thesis.
Most radio is broadcast live, where the audio production happens in real-time, but in these cases there is little opportunity to make the audio production more efficient. For this reason, we have chose to focus only on the production of recorded audio.
Although most radio listeners in the UK tune in to music-based stations, 38% of the population listen to speech-based radio (Office of Communications 2017, pp. 97-105) and 10% listen to podcasts (RAJAR and IpsosMori 2017), which are normally speech-based. Most original radio content is speech-based, so we will focus our research on the production of speech content.
We want to make the most of our access to professional radio producers and work environments. To do this, we will adopt radio producers as our target user group, by involving them in the development and evaluation of our work, and conduct evaluations in the workplace.
Finally, the intention behind this research is to facilitate creative expression, rather than replace it through automation. Our ambition is to find ways for machines and humans to work to each of their strengths, where simple or menial tasks are automated, but there is always a “human in the loop” that makes the decisions. Our hope is that, in addition to making production activities more efficient, this may unlock opportunities for greater creative expression.
1.3 Thesis structure
Chapter 2 introduces previous work that we will build upon in this thesis. We start by giving a general overview of audio editing and semantic audio analysis to provide context to our research. We then survey related techniques and previous systems that have attempted to assist the navigation and editing of audio. These are categorised into audio visualization, semantic speech interfaces and audio playback interfaces. We then reflect upon the literature and our research aim to formulate our research questions.
Chapter 3 investigates existing audio editing workflows in radio production. Our goal is to help inform the direction of our research by gaining a better understanding of the roles, environment, tools, tasks and challenges involved in real-life radio production. We achieve this by conducting three ethnographic case studies of news, drama and documentary production at the BBC, the results of which present three avenues of research. We conclude by reflecting on the results and previous work to form an intervention strategy for answering our research questions.
Chapter 4 evaluates the effect of audio visualization on radio production. Semantic audio analysis techniques have previously been used to enhance visualizations to assist the navigation of audio recordings. However, the effect of this approach on user performance has not been tested. We conduct a user study that quantitatively measures the performance of three audio visualization techniques for a typical radio production task.
Chapter 5 investigates semantic speech editing in the context of real-life radio production. We design and develop Dialogger — a semantic speech editor that integrates with the BBC’s radio production systems. We then describe the results of our qualitative user study of BBC radio producers, who used our editor in the workplace to produce radio programmes for broadcast. We directly compare semantic editing to the current production workflow, and gain insights into the benefits and limitations of this approach.
Chapter 6 investigates the role of paper as a medium for semantic speech editing. Our findings in Chapters 3 and 5 led us to to develop PaperClip — a novel system for editing speech recordings on paper, using a digital pen interface. We describe how we worked with radio producers to refine our prototype, then evaluate our system through a qualitative study of BBC radio producers in the workplace. We directly compare PaperClip and Dialogger to explore the relative benefits of paper and screen interfaces for semantic speech editing.
Chapter 7 concludes the thesis and considers prospects for further research.
1.4 Contributions
The principal contributions of this thesis are:
Chapter 3: The first formal observational study of radio production workflows. A set of novel theoretical models of audio editing workflows that contribute to the academic understanding of professional radio production.
Chapter 4: The first formal study on the effect of audio waveforms and semantic audio visualization on user performance.
Chapter 5: The first application of semantic speech editing to professional radio production. The first formal user study of semantic speech editing for audio production. Insights into the performance, challenges and limitations of semantic speech editing in the context of radio production.
Chapter 6: A novel approach to editing speech recordings on paper through the combination of semantic speech editing and a digital pen interface, and the first evaluation of this approach. Insights into the relative benefits of paper and screen interfaces for semantic speech editing.
1.5 Associated publications
Portions of the work detailed in this thesis have been presented in the following publications:
Chapter 3: Chris Baume, Mark D. Plumbley, and Janko Ćalić (2015). “Use of audio editors in radio production”. In Proceedings of the 138th Audio Engineering Society Convention.
Chapter 5: Chris Baume, Mark D. Plumbley, Janko Ćalić, and David Frohlich (2018). “A Contextual Study of Semantic Speech Editing in Radio Production”. In International Journal of Human-Computer Studies 115, pp. 67–80.
Chapter 6: Chris Baume, Mark D. Plumbley, David Frohlich, and Janko Ćalić (2018). “PaperClip: A Digital Pen Interface for Semantic Speech Editing in Radio Production”. In Journal of the Audio Engineering Society, 66.4.
Software
As part of this research, we have also developed and released the following systems as open-source software:
2 Background
The focus of this thesis is on the production of audio content for radio broadcast. Radio production is both a technical and creative endeavour that combines complex audio technology with artistic taste and judgement (Barbour 2004). The aim of radio production is to “manipulate sound to create an effect or deliver a message”, which is achieved by combining various sources of sound into a programme (Hausman et al. 2012, pp. 12-20). In this chapter, we review methods, systems and technologies that are related to the production of radio, and to the development of the semantic audio production tools in this thesis.
In Section 2.1, we start by giving a brief overview of the methods and tools of audio editing, which is used to create radio programmes. We show how current editing tools use visual representations to interact with audio, and discuss the limitations of these visualizations. In Section 2.2, we show how semantic audio analysis can be used to extract information from audio content to describe the sound. We then consider previous research that has used this semantic data to improve the navigation and editing of audio through the use of audio visualization (Section 2.3), transcripts of speech (Section 2.4), and audio playback interfaces (Section 2.5). Finally, in Section 2.6, we reflect upon the literature and our research aim to formulate the research questions that we will attempt to answer in this thesis.
2.1 Audio editing
The focus of this thesis is on the production of radio programmes using recorded audio. Recording sound ahead of broadcast brings with it a number of benefits (Hausman et al. 2012, p. 133). Programmes can be much more complex, as many more sound elements can be brought together than would be possible in a live scenario. The producer is able to record re-takes of the same material until they are satisfied, which allows them greater freedom to experiment and fix any mistakes that occurred. The ability to re-record material can lead to better quality content and open up opportunities for a wider range of programme genres, such as drama and documentaries. Pre-recording has a number of practical benefits too. The time of production is not constrained by the broadcast schedule, and content for multiple programmes can also be recorded in one session.
Recorded audio is refined through editing. Audio editing is the process of selecting, re-arranging, correcting and assembling audio content into a finished product (Hausman et al. 2012, p. 112). According to McLeish and Link (2015, p. 44) and Hausman et al. (2012, p. 116), the three primary reasons for editing are to:
Re-arrange recorded material into a more logical sequence.
Remove uninteresting, unwanted, repetitive or technically unacceptable sound.
Reduce the running time.
Underlying these practical aims of audio editing is an important creative process. Hausman et al. (2012, p. 116) state that editing is “somewhat like an art form”, and McLeish and Link (2015, p. 44) suggest that editing can be used as a “creative effect to produce juxtapositions of speech, music, sound and silence”.
2.1.1 Digital audio workstations
For more than fifty years, audio was recorded on magnetic tape. Combining sound sources required the use of a large mixing console which was used to control the sound with faders, knobs and buttons that had to be triggered at the right time. Editing was performed by cutting the magnetic tape with a razor blade and sticking it back together again (Barbour 2004).
The development of fast processors and high quality audio interfaces has since allowed audio to be stored and manipulated digitally using computer software. The primary tool for editing digital audio is the digital audio workstation, or DAW. A DAW is software that provides recording, mixing and editing capabilities for digital audio. DAWs were first introduced in the 1980s (Ingebretsen and Stockham 1982), and have since evolved into powerful tools that are accessible to anybody with a computer. Examples of popular commercial DAWs include Pro Tools by Avid, Logic Pro by Apple and Cubase by Steinberg (Ask Audio 2015; Producer Spot 2015).
DAWs provide a feature-rich toolset for manipulating audio signals. They can be used to navigate and edit audio with very fine control over timing, even down to individual samples. Automation means that changes made to the audio are remembered and repeated each time the audio is played. Automatic cross-fading between clips can be used to create inaudible edits.
The introduction of DAWs has transformed radio broadcasting by allowing fast random access, high storage densities, improved portability, and greater cost-effectiveness than analogue systems (Pizzi 1989). The powerful features of a DAW can replace most of the activities that would traditionally have to be performed using a radio studio. The accessibility of digital audio production has allowed audio editing to be performed by producers without requiring specialist knowledge of sound engineering (Peus 2011). McLeish and Link (2015, p. 44) suggested that the improved usability of DAWs has created a “high level of personal job satisfaction” (McLeish and Link 2015, p. 44). However, the deskilling of audio editing has also caused a reduction in the number of people required to produce radio programmes (Dunaway 2000).
As the audio is being stored and manipulated digitally, DAWs can be used to edit audio without any loss in sound quality. However, when the edited audio is saved, there are two approaches that can be taken — destructive and non-destructive (McLeish and Link 2015, p. 45). Destructive editing occurs when a change is made that alters the structure of the sound file. This prevents the edits from being easily undone. Non-destructive editing occurs when the original audio components are retained and can be re-used to make a change to the edit. DAWs can perform non-destructive editing by saving an edit decision list, or EDL, which records the positions of the edits, but does change any audio files. With EDLs, audio edits can be moved or undone retrospectively. Only when the final edit is ready does the audio get destructively “rendered” or “bounced” to an audio file.
2.1.2 Visual representation
Digital audio editing is performed using a visual representation on a computer screen (Derry 2003; Hausman et al. 2012). Barbour (2004) found through observation and interviews with radio producers that “visualization of audio on a screen has become the dominant focus in a radio production studio”, and that visual representations are used to assemble, modify and balance the audio for radio programmes.
Using visual means to interact with audio has a number of benefits. It allows users to manipulate the audio using a mouse and screen, which are commonly used in computing. Mapping audio to an image allows the temporal information of the sound to be displayed spatially, which means it can be searched and skimmed quickly and randomly. However, visualizing audio is difficult, and there are limitations to what audio visualizations can tell us about the audio.
Bouamrane and Luz (2007) argue that “visually representing audio in a meaningful manner is a particularly difficult task as there is no obvious or intuitive way of doing so”. Currently visual representations cannot fully represent the sound, so producers must listen to comprehend the audio. McLeish and Link (2015, p. 45) argue that “while it is tempting to edit visually using the waveform on the screen, it is essential to listen carefully to the sound, [such as to] distinguish between an end-of-sentence breath and a mid-sentence breath”. Visual representations may also serve as a distraction to the producer. Barbour (2004) found that to concentrate on listening, radio producers disengaged their visual senses by shutting or de-focusing their eyes, or looking away.
Although we could not find any studies that surveyed the use of visualizations in DAWs, we looked at the five most popular DAWs (Ask Audio 2015) and found that all of them visualized the audio using a “waveform”.
2.1.2.1 Waveforms
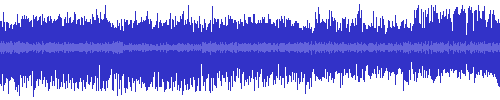
An audio waveform is a common graphical representation of an audio signal that is produced by plotting the amplitude of an audio signal over time. Audio signals are periodic, as sound is produced through compression and rarefaction. This can be seen from the repeating curved lines of the waveform. Lines that are closer together represent higher pitch sounds and lines that are farther apart represent a lower pitch. The height of a waveform corresponds to the amplitude, or “volume”, of the audio.
Waveforms have been used to visually represent audio content since the first digital audio workstations started to appear (Ingebretsen and Stockham 1982). Today, they are the default audio visualization used in the DAWs we surveyed. The simplicity of the waveform makes it conceptually easy for users to understand and interpret the audio. Waveforms are relatively compact, so can be arranged vertically on top of each other to view multiple audio tracks simultaneously. They are also computationally efficient to generate, as they are plotted in the time domain.


Figure 2.1.2.1.1: Example audio waveforms of speech, demonstrating the effect of zoom on the visibility of frequency information.
Despite their widespread use, waveforms display relatively little information about the audio. Figure 2.1.2.1.1 (a) shows a waveform that has been zoomed-in. At this scale, we can see the individual cycles of the audio signal, and the mix of frequencies that make up the sound. However, when we zoom out, these curves are compressed to the point where they are no longer visible. Figure 2.1.2.1.1 (b) shows a waveform at a zoom level typical in audio production. At this scale, it is impossible to determine which frequencies are present. What remains is an “amplitude envelope” that indicates the volume of the sound over time.
Without frequency content, there is a limit to the amount of information waveforms can convey. The amplitude envelope can be used to identify silences, peaks and the relative volume of different parts of the audio. With experience, it is possible to use the amplitude envelope to distinguish different types of sounds. For example, the frequent short periods of silence in Figure 2.1.2.1.1 (b) indicate that this may be speech, because unlike music, speech is broken up into words.
In order to be able to infer this information, users must learn what the amplitude envelope of different sounds look like. This would be a problem for novice producers, but not for professionals who work with audio on a daily basis. However, the level of information that can be inferred is limited (Hausman et al. 2012, p. 114). For example, it is very difficult to use a waveform to distinguish editorially relevant features, such as individual people’s voices, or different styles of music.
We are interested in learning how audio waveforms affect the performance of audio editing tasks. However, despite the widespread use of waveforms to visualize audio, we could not find any studies that have attempted to evaluate their performance as a method of interacting with audio.
2.1.2.2 Spectrograms
A spectrogram is a plot of the intensity of the Short-Time Fourier Transform (Smith 2007), which visually represents of the spectrum of frequencies in an audio signal over time. Higher frequencies are displayed at the top of a spectrogram, and the intensity of the signal is mapped to the brightness (or sometimes colour) of the image. Figure 2.1.2.2.1 shows an example spectrogram of a speech recording.
Spectrograms clearly display the frequencies that make up the sound, and in what proportions. With spectrograms, time and frequency can be scaled independently. Unlike waveforms, when a spectrogram is viewed at different zoom levels, the frequency information is still visible. Spectrograms are based on frequency analysis, so they are more computationally expensive to generate than waveforms, but this is rarely an issue with modern processors.
Like waveforms, spectrograms are general-purpose, so can be used for a variety of tasks and applications. Spectrograms display a much higher density of information than waveforms, which can be used to infer more information. For example, Zue and Cole (1979; Zue and Lamel 1986) found that expert users were able to use spectrograms to read individual phonemes of speech, but inexperienced users were unable to achieve this. Although spectrograms present the data clearly, users must still learn how to read the information.
Reading spectrograms requires users to have a theoretical understand of audio frequencies and how they behave, such as how a single pitch can be composed of many harmonics. Although spectrograms display the intensity of the signal in each frequency band, it is not apparent what the overall volume of the audio is at a given time. Additionally, spectrograms have a wide range of parameters that control how they are displayed, including FFT window size and shape, linear/non-linear frequency and intensity scaling, min/max values and colour mapping. This creates inconsistencies between different spectrograms, which can make it difficult for users to move between software. Waveforms don’t have as many parameters, so are much more consistent.
In Section 2.3, we will show how waveforms and spectrograms can be enhanced using semantic audio features, but first we will introduce the relevant methods and applications of semantic audio analysis.

2.2 Semantic audio analysis
Semantic audio analysis is the extraction of descriptive and perceptual attributes from an audio signal, which can be used to describe sound in human-readable terms. Semantic audio can make sound recordings less “opaque” by allowing users to understand what is contained in the audio without having to listen to it first. This approach can be applied to the improvement of audio production interfaces. For example, Fazekas and Sandler (2007) enhanced a DAW to assist music producers in navigating and editing their content by automatically segmenting music into verses and choruses. We are interested in how semantic audio analysis can be applied to user interfaces for the purpose of assisting the production of radio.
In this section, we will provide an overview of methods and applications of semantic audio analysis. Semantic audio brings together a wide variety of disciplines, including speech recognition, information retrieval, audio analysis, signal processing, psychoacoustics, and machine learning (Foote 1999). As such, we will only aim to provide a brief overview of selected methods and applications that are relevant to the technology used and the systems developed in this thesis. As the focus of our research is on the pre-production of speech programmes, we will only cover methods and applications related to speech content, which notably excludes the active field of music information retrieval (Downie 2008).
2.2.1 Semantic audio features
Semantic audio analysis is conducted by processing the audio using an algorithm to extract one or more semantically relevant “features”. This process known as feature extraction. Audio features are numerical representations of certain properties of the audio, which are often categorised into low-level and high-level features (Fazekas 2012, p. 31). Low-level features include physical and perceptual properties, such as the energy and spectral content of the sound. High-level audio features correspond to more meaningful concepts, such as words and people, or structural segments, such as programmes or topics. Many semantic audio algorithms use classification or machine learning to map low-level features into high-level features. For example, in speech recognition, a language model is used to map individual phonemes of speech into words and sentences (Junqua and Haton 1995).
There are many different types of audio features that can be extracted. With music, rhythmic features are used to extract the beats and tempo, and harmonic features are used to determine the notes and chords. Speech is in some ways a more complex signal to analyse, so more generic features are often used. In this section, we will describe selected audio features that are touched upon later in this thesis, to help illuminate the reader’s understanding of their origin. Below we have outlined three types: energy, temporal and spectral features.
2.2.1.1 Energy features
Energy features are based on the energy of the audio signal, and how it changes over time. Similarly to audio waveforms, energy features can be used to infer certain properties of the sound, such as whether it is likely to be music or speech. Calculating energy features is often computationally efficient, which makes them attractive for use in real-time applications, or on large data sets.
A simple and popular low-level energy feature is root mean square (RMS), which is calculated as the square root of the mean square of the audio signal (see Equation 2.2.1.1.1). RMS is commonly used in scientific work as a measurement of a signal’s power. The statistics of an audio signal’s RMS value can be used as an effective classifier of music and speech, as demonstrated by Ericsson (2009) and Panagiotakis and Tziritas (2005).
\[\begin{aligned} x_{rms} &= \sqrt{\frac{1}{N} \displaystyle\sum\limits_{i=0}^{N} x_i^2} \end{aligned}\qquad(2.2.1.1.1)\]
where \(x_i\) are the audio samples and \(N\) is the frame size.
RMS is also used as the basis for other features. Low energy ratio (also known as “silent interval frequency”, “silence ratio” or “energy contour dip”) is a measure of the number of RMS values in a moving window that fall below a threshold (Liang et al. 2005). It is used for speech/music discrimination (SMD), and works by exploiting the fact that speech has frequent silent gaps between words, whereas music does not. The threshold can be set as a fixed value (Liang et al. 2005), a function of a moving average (Ericsson 2009) or moving peak value (Saunders 1996).
2.2.1.2 Temporal features
Temporal features are based on statistics of the audio samples. These statistics are calculated in the time domain, so like energy features, temporal features are computationally efficient. A popular temporal feature is zero-crossing rate (ZCR), which is the rate at which a signal crosses the time axis (Zhang and Kuo 2001, 606:37). ZCR can be used as a crude measure of pitch, or distribution of spectral energy.
Early work in SMD (Saunders 1996) identified that “speech signals produce a marked rise in the ZCR during periods of fricativity occurring at the beginning and end of words”, whereas music does not. This causes a bimodality in the distribution of the ZCR, which can be detected by measuring its “skewness”. Panagiotakis and Tziritas (2005) also found that “RMS and ZCR are somewhat correlated for speech signals, while essentially independent for music”, and so the product of RMS and ZCR can also be used as a SMD classifier.
2.2.1.3 Spectral features
Spectral features decompose the audio signal into individual frequency bands to analyse the frequencies that are present in the signal, and in what proportion. This is commonly performed using a fast Fourier transform (Smith 2007).
Spectral centroid (Smaragdis, Radhakrishnan, and Wilson 2009) is a measure of the “centre of mass” of the spectrum, calculated as the mean of the audio frequencies, weighted by the magnitude of each frequency bin (see Equation 2.2.1.3.1). Audio that has more higher frequencies than lower frequencies has a higher spectral centroid value, and vice-versa. Spectral centroid is a good predictor of the perceived “brightness” of the audio, which can be used to distinguish sounds of different timbre (Schubert, Wolfe, and Tarnopolsky 2004).
\[\begin{aligned} s_{centroid} &= \frac{ \sum_{n=0}^{N-1} f(n) x(n) } { \sum_{n=0}^{N-1} x(n) } \end{aligned}\qquad(2.2.1.3.1)\]
where \(x(n)\) is the magnitude and \(f(n)\) is the centre frequency of bin \(n\).
The cepstrum of a signal is the power spectrum of the log of its power spectrum (Noll 1967). The cepstrum is a compact representation of how the frequencies in a signal change over time. The Mel-frequency cepstrum is calculated by spacing the frequency bands using the Mel scale (Stevens and Volkmann 1937), which gives a better approximation to the human hearing system. The audio features produced through this process are called Mel-frequency Cepstral Coefficients, or MFCCs (Imai 1983). MFCCs are commonly used as a speech analysis tool, and have been successfully applied to SMD (Liang et al. 2005; Pikrakis, Giannakopoulos, and Theodoridis 2008; A. Pikrakis, Giannakopoulos, and Theodoridis 2006; Sell and Clark 2014; Wieser, Husinsky, and Seidl 2014) and speaker segmentation (Anguera Miro et al. 2012; Friedland et al. 2009), as well as many other problems.
Now that we have a general understanding of some common semantic audio features, we will see how they have been used for applications related to radio production.
2.2.2 Applications
Semantic audio analysis allows us to gain insights into the content of audio recordings without having to listen to them. The semantic audio features we described have already been used to tackle a variety of problems (Foote 1999). In this section, we outline the aim, methods and performance of three applications of semantic audio analysis that are used later in this thesis: speech/music discrimination, speaker diarization and automatic speech recognition.
2.2.2.1 Speech/music discrimination
Speech/music discrimination (SMD) is the task of segmenting and labelling audio content into sections of either music or speech. Many SMD systems have been specifically developed for use with radio broadcasts (Saunders 1996; Aggelos Pikrakis, Giannakopoulos, and Theodoridis 2006; Pikrakis, Giannakopoulos, and Theodoridis 2008; Ericsson 2009; Wieser, Husinsky, and Seidl 2014) and television broadcasts (Seyerlehner et al. 2007; Sell and Clark 2014). SMD systems have been successfully implemented using a variety of different features, including low energy ratio (Ericsson 2009), ZCR skewness (Saunders 1996), spectral entropy (Aggelos Pikrakis, Giannakopoulos, and Theodoridis 2006), continuous frequency activation (Seyerlehner et al. 2007; Wieser, Husinsky, and Seidl 2014), chromagrams (Sell and Clark 2014) and MFCCs (Pikrakis, Giannakopoulos, and Theodoridis 2008). Carey, Parris, and Lloyd-Thomas (1999) compares the performance of some common SMD audio features.
Most SMD systems report high accuracy figures of 96% and above, which shows that automatic SMD is likely to be useful in real-life applications. However, as Pikrakis, Giannakopoulos, and Theodoridis (2008) argues, each system is evaluated using different data sets that are inconsistent in content and length, which makes it difficult to compare them.
Wieser, Husinsky, and Seidl (2014) showed that by including a “human in the loop”, the accuracy of their SMD increased from 96.6% to 100%. They achieved this by adding a user-adjustable slider to their interface that controlled the detection threshold. When the user adjusted the slider, they could see the effect on the segmentation directly to help them find the correct setting.
2.2.2.2 Speaker diarization
Speaker diarization is the task of segmenting an audio recording into labelled segments that identify “who spoke when” (Anguera Miro et al. 2012). With this task, the location of any speech content and number of speakers is usually unknown. Speaker diarization has clear applications to the production of radio, where there are often multiple people speaking in a single recording, and it is desirable to know where they are speaking without having to listen.
Review papers from Tranter and Reynolds (2006) and Anguera Miro et al. (2012) show that the vast majority of speaker diarization systems are based on clustering of MFCCs, and that current research is focused on the improvement of clustering algorithms and pre-processing stages, rather than audio features. They also show that most of the recent research has focused on recordings of meetings, rather than broadcast content.
Anguera Miro et al. (2012) found that the average error rate for speaker diarization systems was 11.6% and 17.7% for two standard data sets (National Institute of Standards and Technology (NIST) 2016). However, these data sets are based on microphone recordings of meetings, rather than broadcast content. Bell et al. (2015) conducted an evaluation of speaker diarization systems on television recordings of multiple genres. These results showed that the error rate was 47.5%, which is considerably higher. However, rather than just trying to match speakers within individual recordings, their evaluation was conducted across multiple recordings, which made matching speakers between them all more difficult. A breakdown of the results showed that most of the errors were misidentification of speakers, and that misidentification of speech accounted for less than 8% of the error rate.
Speaker diarization systems assign a unique identity to each speaker, but they do not attempt to identify who the speaker is. Speaker recognition is the task of identifying a person based on the sound of their voice (Doddington 1985; Lee, Soong, and Paliwal 1999). Extracting metadata such as participant names and genders from radio content could be used to enable automated information searching and indexing (Kinnunen and Li 2010). Speaker recognition relies on access to a database of trained speaker models, which represent people’s voices. In radio, many of the contributors are from a small pool of presenters, so it may be feasible to use speaker recognition techniques to detect their voices with sufficient accuracy.
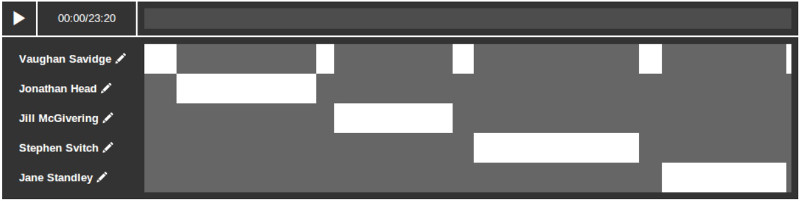
Raimond et al. (2014) introduced the BBC World Service Archive prototype, which was an interface that used automatic keyword tagging and crowd-sourcing to support the search and discovery of a large radio archive. The interface used speaker diarization and speaker recognition to help users navigate within individual radio programmes. Figure 2.2.2.2.1 shows an example of a radio programme that has been segmented into five named speakers.
2.2.2.3 Automatic speech recognition
Automatic speech recognition (ASR) can be used to automatically convert speech to text. The ability to convert audio signals to text opens up many possibilities in radio production, such as being able to navigate audio recordings through searching and skimming. These opportunities are discussed in greater detail in Section 2.4.
Modern ASR systems can be broken down into two main stages (Junqua and Haton 1995). The first stage uses an acoustic model to map the audio to a set of phonemes, which are the individual noises that make up the speech. In the second stage, a language model converts the sequence of phonemes into words and sentences. Both the acoustic and language models are developed using machine learning techniques to train the system based on recordings and transcripts of speech. As such, the success of an ASR system depends on the quality and fitness of the data that it is trained on.
Despite advances in the field (Lee, Soong, and Paliwal 1999), ASR produces erroneous transcripts. Bell et al. (2015) conducted an evaluation of ASR systems on television programmes of various genres. Each system was judged by the proportion of incorrect words, known as the “word error rate” (WER). The mean average WER of the systems tested was 23.7%, however the variance across programme genres was high, with the WER varying from 10 – 41% across the 16 genres tested.
Figure 2.2.2.3.1 shows an example of a transcript generated by an ASR system with a WER of approximately 16%. ASR transcripts don’t include letter capitalisation or punctuation, but this can be estimated and added using post-processing (Gravano, Jansche, and Bacchiani 2009).
[Speaker 1] the manchurian candidate both seems to play up these fears and to be in a way in she comes to sudden he can have a critique of the idea of the moral panic around brainwashing i wondered where pavlov fits into that story and how seriously are his ideas taken in the literature of the nineteen fifties around brainwashing

[Speaker 2] we'll have a viz is everywhere in in the discussion of the american p.o.w.s they're sometimes referred to in magazine articles and in popular commentary at the time as as prisoners of pavlov so there was a larger of of of our popular discussion about pavlov often not very well informed but only rouge to his experiments with the conditioned reflex and his famous salivating dogs and ringing bow and so on that was was everywhere so certainly many americans would have at associated some kind of pavlovian conditioning with what had been done to the p.o.w.s but but it wasn't generally carried very far into in terms of actually trying to him better understand how pavlovian principles or psychology might might actually have been at work in the p.o.w. camps
2.3 Audio visualization
In the last section, we explored how semantic audio analysis can be used to extract information from audio, but did not discuss how such information is presented to the user. As we shall see in this section, semantic information can be used to support interaction with audio recordings by using it to enhance audio visualizations.
Audio visualization is the task of mapping an audio signal to an image. The human visual system is capable of viewing an entire image at once, and is adept at searching and skimming images (Wolfe and Horowitz 2004). On the other hand, sound must be consumed serially and over a period of time. Mapping sound to vision allows temporal information to be displayed spatially, which can overcome some of the limitations of a time-based medium like sound.
We saw in Section 2.1.1 that audio visualization is already used by DAWs to help users navigate and edit audio content. However, we also saw that current audio visualizations are limited in what they can display. For example, waveforms only display amplitude information, much of which cannot be seen at typical zoom levels. To effectively navigate audio waveforms, users must read the shape of the visualization.
In this section, we will see how previous research has proposed a number of enhancements to current audio visualizations that aim to improve their performance. We start by looking at the relationship between sound and vision, and considering the perceptual mappings between the two that already exist. We then review techniques that have previously been used to process or enhance waveforms and spectrograms to make it easier for users to navigate and edit audio recordings.
2.3.1 Crossmodality
To be able to represent audio visually, we must map auditory properties to visual properties. When attempting to link sound and vision, it is desirable to create a mapping that is coherent and makes sense to the user. By creating an audio visualisation that “looks likes it sounds”, it might be possible for users to comprehend the sound without having to listen to it.
Crossmodal perception is a term used to describe interaction between the different senses (Spence 2011). Previous work has shown that there are perceptual mappings between auditory and visual stimuli that are experienced by most of the population. These could be exploited to aid the navigation and editing of audio recordings.
The “bouba/kiki effect” is a demonstration of crossmodal mapping between speech sounds and the visual shape of objects, originally discovered in an experiment by Köhler (1929). Participants were shown two abstract shapes, shown in Figure 2.3.1.1, and asked which shape was called “bouba” and which was called “kiki”Köhler used the words “baluma” and “takete” in the original experiment, but the result was the same.
. Ramachandran and Hubbard (2001) found that 95–98% of the population gave the same answerThe vast majority of participants chose to name the curvy, rounded shape on the left “bouba”, and the sharp, pointy shape on the right “kiki”.
. This is an example of just one audio-visual mapping that is common amongst the population.

Spence (2011) presented a review of psychology experiments that attempted to find crossmodal links in the human brain, including audio-visual mapping. He found that there was strong evidence for five audio-visual mappings, shown in Table 2.3.1.1. These findings were supported by Tsiros (2014), who attempted to generate images to match different sounds, and measured their success through a user study. In addition to confirming the strong links between loudness/size and pitch/elevation, he found weaker links for pitch/colour, dissonance/granularity, and dissonance/colour complexity.
| Link | Direction |
|---|---|
| Loudness/brightness | louder=brighter |
| Pitch/elevation | higher=higher |
| Pitch/size | higher=smaller |
| Loudness/size | louder=bigger |
| Pitch/spatial frequency | higher=higher |
Current audio visualizations exploit some of these crossmodal mappings. For example, waveforms map loudness to size, and spectrograms map loudness to brightness, and pitch to elevation. However, this previous work shows that there are many more links between sound and vision that could be further exploited by audio visualizations.
2.3.2 Waveforms
As we discussed in Section 2.1.2.1, the audio waveform is commonly used by DAWs as a visualization of an audio signal (Derry 2003). As such, many users are familiar with navigating audio content using waveforms, and have learned how to read the shapes of the waveform. Enhancing a waveform, either by processing it or adding additional information to it, could allow users to navigate and edit audio content more efficiently whilst retaining this familiarity, and using the skills they have developed. Our survey of the literature found that two main approaches have been used to enhance waveforms — scaling and colour.
2.3.2.1 Scaling
When an audio waveform is zoomed out, the curves of the waveform are compressed which can make it difficult to read. This affects both horizontal zoom (on the time axis) and vertical zoom. One very simple technique for improving waveform readability is to automatically scale the vertical zoom to match what is visible on the horizontal timeline. However, if the scale of the waveform constantly shifts, there is no reference level by which to compare the amplitude of the audio. The solution proposed by Goudeseune (2012, p. 39) was to overlaying a dimmed version of the scaled waveform on top of the normal waveform. This allowed users to simultaneously judge the overall amplitude whilst being able to see the detail of the amplitude envelope.
Frequency information is useful for understanding the timbre of an audio signal. When viewed at the right scale, this information is visible in a waveform, but at typical zoom levels, this information is lost. J. Loviscach (2011b) proposed a novel solution to this problem called the quintessence waveform. This approach used extreme pitch shifting so that the individual cycles of the audio waveform are visible, even at different scales. This works well for repeating monoaural sounds — for example, a sine wave would be identifiable as a sine wave at every zoom level. However, typical real-life applications use complex polyphonic audio, which would not benefit from quintessence waveforms as there is no repeating signal to display.
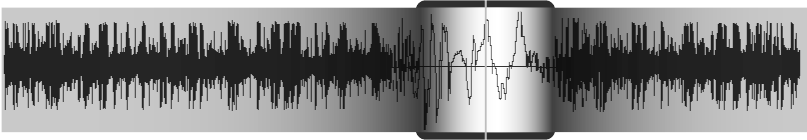
Gohlke et al. (2010) proposed five novel ideas on how to improve multi-track DAW displays, including techniques for saving screen space by overlaying and stacking waveforms. One of these proposals was for a lens-like view, shown in Figure 2.3.2.1.1, which magnified the area of the waveform around the current playhead position. This allowed users to simultaneously view the waveform at two different scales — an overview of the audio waveform and a detailed local view. This technique has the potential to display frequency information in regions of interest, and help make more precise audio edits without having to adjust the overall zoom level.
2.3.2.2 Colour
The use of colour is a simple and effective way of adding additional information to a waveform. However, many DAWs only use waveform colour to allow users to label audio clips, and most others have monochromatic waveforms. Previous research has experimented with mapping semantic audio features to colour, using either pseudocolour or false colour.
Pseudocolour is a method of mapping a scalar value to a colour gradient (Moreland 2009), an example of which can be seen on thermal imaging cameras. Colour gradients are composed of at least two colours (e.g. blue to red) or a spectrum of colours (e.g. a rainbow). Pseudocolour allows values to be mapped to colours that might be perceptually relevant (e.g. green/red for good/bad). It can emphasise small variations between values by using a full spectrum, pick out high/low values using non-linear gradients, or categorise values using stepped gradients. However, as pseudocolour can only represent one dimension, it does not make full use of the available colour space.
False colour exploits the tristimulus theory of vision to map three values to the dimensions of a colour space (Moreland 2009). Commonly, values are mapped to red/green/blue (RGB) colour space. Other colour spaces can be used, such as hue, saturation, value (HSV), which better matches human perception of colour (Smith 1978). Hue can be described as “the colour on a rainbow”, saturation represents lack of greyness, and value means brightness. The advantage of false colour is that it can make full use of the available colours. On the other hand, it can be challenging to select three values and map them to colour in a way that is perceptually relevant and understandable.
Rice (2005) presented Comparisonics — a patented (Rice and Patten 2001) method of using pseudocolour to map the frequency content of an audio signal to a colour spectrum. Comparisonics was designed for identifying timbrally distinct sounds and he claims that, with training, it can be used to identify certain sound effects. His technique maps frequency to colour using an unpublished algorithm, where low frequencies are blue and high frequencies are red. Comparisonics has since been integrated into the Scratch LIVE DJ software from Serato Audio Research, where it is used to distinguish between different drum noises, such as bass kicks, snares and high-hats. However, the author could not find any formal evaluation of Comparisonics.
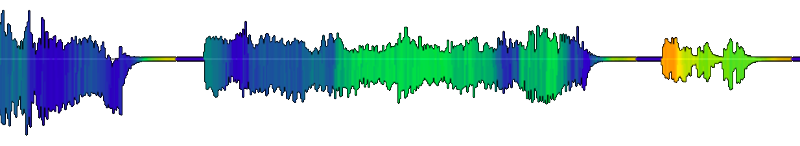
Akkermans et al. (2011) implemented a similar system in the audio clip sharing website Freesound to help users quickly find and compare sound effects and music clips. They used pseudocolour to map the spectral centroid of the audio (see Section 2.2.1.3) to a rainbow colour gradient. This colours lower frequency sounds blue and higher frequency sounds red, matching the effect seen in Rice (2005). An example of this approach is shown in Figure 2.3.2.2.1. J. Loviscach (2011a) used pseudocolour to enhance the navigation of speech in a video editor by distinguishing different phonemes of speech. This was achieved by mapping the zero-crossing rate of the audio (see Section 2.2.1.2) to a rainbow colour spectrum. The author could not find any studies that attempted to evaluate these approaches.
Tzanetakis and Cook (2000) used false colour to design a visualisation technique known as Timbregrams. Their aim was to “use colour perception and the pattern recognition capabilities of the human visual system to depict timbral and temporal information”. Their implementation extracted a large vector of common audio features, then used principal component analysis to reduce the size of the vector. They mapped the first three principal components, which contained 80% of the variance in their data, to RGB or HSV colour space. They found that the RGB colour space was more uniform and aesthetically pleasing, but that the HSV colour space had better contrast at segmentation boundaries. When using RGB, speech, classical music and rock could easily be distinguished as they appeared as light green, dark blue and dark green, respectively. Tibregrams were later used to colour a waveform in a basic audio editor (Tzanetakis and Cook 2001, p. 253), but the author could not find any formal evaluation of Timbregrams.
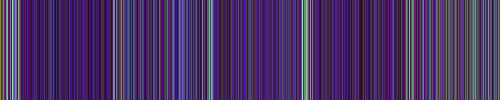
Mason, Evans, and Sheikh (2007) used false colour to assist radio listeners in navigating recently-broadcast material. They mapped three empirically-chosen audio features to RGB colour space. The authors reported that the system was successful at indicating the location of music within speech content, and highlighting low-bandwidth material such as phone calls. However, this was not formally evaluated. The authors proposed that the system could be also be applied to other applications such as segmentation of radio programmes for re-editing into podcasts. Figure 2.3.2.2.2 shows an example of this approach for a BBC radio programme that contains five segments. Although the segments are not visible in the waveform, the false colour visualization displays the voice of the female presenter in a lighter colour, which makes the segments visible.
2.3.3 Spectrograms
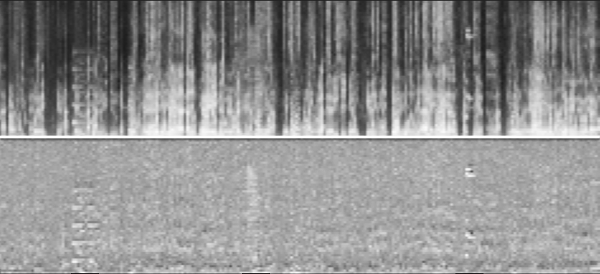
As we discussed in Section 2.1.2.2, spectrograms are an information-rich representation of the spectrum of frequencies in an audio signal over time, but they can be difficult for novice users to read. Lin et al. (2012) introduced a method of filtering spectrograms to visually emphasise non-speech events in long audio recordings. The filtering was done using an “image saliency algorithm” that detected differences in the intensity and orientation of the spectrogram. This saliency-maximised spectrogram was integrated into an audio navigation interface called Timeliner (Goudeseune 2012), which displayed the spectrogram alongside a waveform. Lin et al. (2013) describes an evaluation in which 12 novice participants used Timeliner to find sound effects hidden in meeting room recordings using both saliency-maximised and normal spectrograms. The results show that saliency-maximised spectrograms significantly outperformed normal spectrograms. Filtering spectrograms shows promise as a way of detecting unusual events, however it is unclear how useful this sort of application would be in the context of radio production.
2.4 Semantic speech interfaces
Speech recordings can be converted to text in a process known as “transcription”. Transcripts can be used to record exactly what somebody said, and the transcript text can be read, copied, shared, skimmed and searched using a variety of tools, such as word processors, or on paper. Hausman et al. (2012, p. 133) notes that radio producers currently “cut, paste and copy sound files much the same way we use a word processor to manipulate words, sentences and paragraphs”. In this section, we will see how transcripts can be used as an interface to aid the navigation and editing of speech recordings.
2.4.1 Transcript generation
Transcripts can be written manually, either using pen and paper or a word processor, but this is a slow and tedious process. Transcription can be completed faster by only transcribing the most salient words, but this makes the transcript much less readable, particularly to others who haven’t heard the original recording. Alternatively, a third-party can be used to transcribe the speech, but this slow and expensive. For example, transcribing speech using rev.com currently costs US$1 per minute and takes 12 hourshttps://www.rev.com/transcription, accessed 11/12/2017
.
As we saw in Section 2.2.2.3, ASR can be used to convert speech to text automatically. ASR is quicker and cheaper than manual transcription. ASR also produces accurate timestamps for each word, which can be used to precisely navigate and edit the audio, but word-level timestamps can also be added to manually-written transcripts using speech alignment (Griggs 2007; Boháč and Blavka 2013).
Erroneous transcripts reduce listener comprehension (Stark, Whittaker, and Hirschberg 2000; Vemuri et al. 2004) and increase the time it takes to search audio content (Ranjan, Balakrishnan, and Chignell 2006) and correct errors (Burke, Amento, and Isenhour 2006). However, despite the errors in ASR transcripts, they provide a highly effective tool for browsing audio content as users can visually scan the text to focus on regions of interest, known as “strategic fixation” (Whittaker and Hirschberg 2007).
2.4.3 Semantic speech editing
In addition to supporting the navigation of speech recordings, transcripts have also been used as a method of editing speech content, known as semantic speech editing. The first of these was the “Large Interactive Display System Wave Speech Editor”, catchily shortened as LIDSWSEdit, from Apperley et al. (2002), which used ASR transcripts to allow users to navigate and edit lecture recordings. Any edits made to the transcript were correspondingly applied to the underlying audio recording. Users could re-arrange sentences and words by selecting the text, and using a drag-and-drop action. Alternatively, speech could be removed by selecting text then clicking a button to either delete the selected text, or everything except the selected text. LIDSWSEdit was further developed into the “TRanscription-based Audio EDitor”, or TRAED (Masoodian et al. 2006). TRAED used the same editing actions as LIDSWSEdit, but rather than displaying the text and audio waveform separately, it displayed the waveform in-line with the text. Individual words were delineated by drawing boxes around the waveform/word pair. The boundary between each pair could be adjusted by dragging the boundary edge. The author could not find any user studies of LIDSWSEdit or TRAED.
Whittaker and Amento (2004) created an interface for editing voicemail messages using ASR transcripts. Users could cut-and-paste parts that they wanted, or delete parts they didn’t. They evaluated their system in a formal study of 16 voicemail users, which found that semantic editing was faster and as accurate as editing with a waveform. Crucially, they found that this was true even though the transcripts had an average word error rate of 28%. This suggests that semantic editing is beneficial even when using erroneous transcripts.
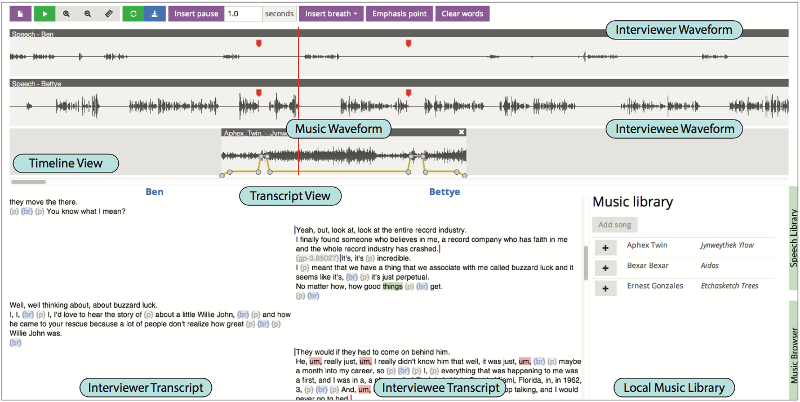
Rubin et al. (2013; Rubin 2015) presented a novel interface for creating “audio stories” that combine speech and music, which is similar to radio production. The interface, shown in Figure 2.4.3.1, used an editable transcript with two columns, one for each of a pair of speakers. It allowed the user to cut, copy, paste and delete the audio using the text, and highlighted repeated words and similar sentences. The transcripts were generated using an online service that produced 100% accurate, or “verbatim”, transcripts. As they were manually-generated, the transcripts also included “umm”s, breaths and pauses, which were displayed and labelled in the interface. However, the manual transcripts did not include timestamps, so speech alignment software was used to recover the timestamps for each word. The system also included additional functionality for finding and adding music tracks, and for varying the length of music using automatic looping. The system was evaluated through a short informal study of four participants where the editing capabilities received positive feedback. The author could not find any follow-up studies.
Sivaraman, Yoon, and Mitros (2016) created a semantic editing system for asynchronous voice-based discussions, where users could quickly edit their speech recording before sending it to the recipient. Their system used near-live ASR and detected pauses in the speech. Their interface allowed users to delete selected words/pauses, insert additional pauses and fix incorrect words. In a formal qualitative study of their system with nine users, they found that text-based editing was considered good enough to replace waveform editing, and to be more accessible. They observed that most users only used the system to make fine-grained edits, instead of editing large chunks. Users said that the transcript also allowed them to quickly review all the points that were made, and that the errors in the transcript weren’t a heavy distraction.
Yoon et al. (2014) created a collaborative tablet-based document annotation system called RichReview, which offered users three modalities in which to annotate documents — free-form inking, voice recording and deictic gestures (i.e. pointing to areas of interest). The voice recordings were displayed using a waveform, overlaid with an ASR transcript of the speech. Users could trim or tidy the voice recordings by drawing a line through words or pauses to remove them. The system was evaluated using a qualitative study of 12 students which found that the editing features were considered easy to use and efficient for removing “umm”s and long pauses. However many participants reported that the transcripts were not accurate enough to use without having to listen to the audio. Yoon et al. (2016) describes two deployment studies that used a similar system called RichReview++, but they did not report there being any semantic editing functionality.
2.4.4 Video editing
Semantic speech editing has also been used to support video editing. SILVER (Casares et al. 2002; Long et al. 2003) was a video editor that aligned words from subtitles to the video, and displayed them in a transcript window. Gaps, errors and edits were displayed in the transcript using special characters, such as “||’‘for clip boundaries, “—’’ for gaps, and”*’’ for noise or recognition errors. The video could be edited by deleting text in the transcript. SILVER was evaluated in an informal study with seven students, but the study did not report any results about the transcript-based editing feature.
Hyperaudio Pad is an open-source audio and video editor, first proposed by Boas (2011), and now available online as a free service (Hyperaudio Inc. 2016). This web-based interface, shown in Figure 2.4.4.1, allows users to navigate and edit online media using transcripts, which are generated from subtitles. Editing is performed by selecting a part of the transcript and dragging it into a window on the right to create a “clip”. Clips can be re-ordered, split using a “trim” tool, and fade effects can be added between clips. Clips from different recordings can be mixed together, and the final edited version can be played and shared with others. No user studies of this system could be found.
When editing a video interview, it is desirable to avoid making a cut while the person speaking is in shot, because it causes the image to jump unnaturally. Berthouzoz, Li, and Agrawala (2012) used image processing algorithms to create a video editor that can help the user hide these edit points. The system had an editable transcript window that displayed suitable edit points and allowed the user to edit the video by selecting and deleting text. The transcripts were generated manually using an online crowd-sourcing service, and word timings were added using speech alignment software. The system also allowed users to easily remove “umm”s or repeated words as they were explicitly marked in the manual transcript. No user study was reported, however the system received positive feedback from nine professionals who were given a demonstration.
2.4.5 Pre-written scripts
The systems so far have only considered transcripts that have been generated from the speech itself. Sometimes speech is recorded based on a pre-written script, or from notes. Avid Technology released a feature for their Media Composer video editing software in 2007 called ScriptSync (Avid Technology Inc. 2011). This feature aligns a user-supplied transcript to a video recording by placing a marker in the video for each line of the transcript (Griggs 2007). This allows users to jump to a particular line, or see which line in the transcript corresponds to the current point in the video. A second version of ScriptSync was launched in February 2017 (Avid Technology Inc. 2017) which added script correction and collaborative note-taking.
Shin, Li, and Durand (2016) created a system called Voice Script that supports an integrated workflow for writing scripts, and recording/editing audio. An informal study with four amateur participants found that it could support various workflows including multiple iterations. It included a “master script” layout to bring together different recordings, which was found to work well. A second study of four amateur participants directly compared the system to that of Rubin et al. (2013), which found that participants were able to complete an audio production task 25% faster using the Voice Script system. This study demonstrates that for workflows that involve pre-written scripts, there is potential to improve the audio editing by using an integrated writing and editing system.
QuickCut from Truong et al. (2016) was an interface designed to help producers edit a narrated video from a pre-written script, voiceover audio and raw video footage. Producers could label their video footage using their voice, which was manually transcribed using a crowd-sourced online service in combination with speech alignment. Selecting text in the script also selected the corresponding segment in the voiceover audio, and displayed video clips labelled with similar words. After selecting an appropriate clip, it could be associated with a position in the script by using drag-and-drop to add it to the timeline. The completed timeline could then be exported as an EDL for use in professional video editing software. QuickCut was evaluated by the researchers themselves and one professional filmmaker, who were able to use the system to produce a minute of video in 8–31 minutes, rather than the 2–5 hours professional filmmakers suggest they require. Voice-based logging makes sense for logging video footage as it is easy to watch and talk at the same time. However, for speech content it would be difficult to talk and listen simultaneously. The ability to export edits to professional software allows for a smooth continuation of the production workflow.
2.4.6 Transcript correction
Whittaker and Amento (2004) found that users of their semantic speech editing system “wanted to be able to correct errors they found in the transcript”. ASR errors reduce listener comprehension (Stark, Whittaker, and Hirschberg 2000; Vemuri et al. 2004) and increase the time it takes to search audio content (Ranjan, Balakrishnan, and Chignell 2006) and correct errors (Burke, Amento, and Isenhour 2006).
Four of the ASR transcript interfaces mentioned above included correction functionality, with each using a different method to edit the text. SILVER (Casares et al. 2002) required the user to both type the replacement word and select the start and end time of the word in the video timeline. TRAED (Masoodian et al. 2006) allowed users to correct a word by selecting it and typing the replacement. Typing a space created a new word by dividing the time of the original word in half. Sivaraman, Yoon, and Mitros (2016) initially planned to have two editing modes — one for audio editing and the other for text editing. However, in pilot testing they found that having two modes confused users, so they developed a pop-up box that indicated to the user when they are editing the text, rather than the audio. SCANMail did not initially include transcript correction, but this was later added and evaluated by Burke, Amento, and Isenhour (2006). These changes allowed users to either replace an individual word by selecting a replacement from a drop-down menu, or replace multiple words by selecting them and typing the replacement. A user study of 16 participants who corrected voicemail messages found that compared to typing, selecting the replacement word required the user to listen to less of the audio.
The correction process can be made more efficient by correlating the user’s input with contextual information (Suhm, Myers, and Waibel 2001). In particular, the words immediately before and after the incorrect word can be used to reduce the number of candidate words, or even estimate the replacement. Liang, Iwano, and Shinoda (2014) showed that once an incorrect word is identified, in 30% of cases the correct word can automatically be inferred using \(n\)-grams and acoustic features.
Correction is normally a process that happens after ASR transcription, but as Wald et al. (2007) demonstrated, it is possible to correct ASR transcripts in real-time as the audio is captured. However, during recordings, radio producers are normally pre-occupied with operating the equipment, asking questions or listening to the answers. As this does not leave enough space for performing real-time correction, an extra producer would be required, which is costly.
The above systems used a keyboard and mouse interface to correct transcripts. Suhm, Myers, and Waibel (2001) tested alternatives methods that used vocal correction and a pen interface. They found that for skilled typists, keyboard and mouse input was faster than the alternatives, but that voice and pen input would be attractive for use by poor typists, or for devices that don’t allow fast keyboard input.
ASR transcripts contain errors in the text, but sometimes there are errors in the speech itself that producers may want to correct. TypeTalker from Arawjo, Yoon, and Guimbretière (2017) was an interface for editing synthesised speech using ASR transcripts. The speech was not synthesised from text, but from a recording of the user speaking. This was done to reduce the self-consciousness that results from hearing one’s own voice. As well as being able to remove unwanted speech, the use of speech synthesis meant that new speech could be synthesised and words could be changed. Adobe Systems Inc. (2016) demonstrated an unreleased prototype system called VoCo that enabled users to change a word in a speech recording, whilst retaining the natural characteristics of the original speaker’s voice. Such technology could be used to create seamless repairs to errors in speech recordings. However, the use of such technology has ethical and legal implications, particularly in a broadcasting context (Bendel 2017)There’s an interesting episode of Radiolab that discusses this: http://www.radiolab.org/story/breaking-news/
.
2.4.7 Confidence shading
In addition to producing a transcript, many ASR systems return a confidence score for each transcribed word, indicating how sure the system is that the word is correct. Confidence shading is a technique for displaying this score by colouring words with a low confidence score in a lighter shade (Suhm, Myers, and Waibel 2001). Confidence shading has been used to try to make mistakes easier to locate, and transcripts easier to read. However, confidence scores may themselves be incorrect by indicating that a correct word is probably incorrect, or that an incorrect word is probably correct. The trade-off between these two types of errors is controlled using the threshold value (Feng and Sears 2004).
Suhm, Myers, and Waibel (2001) conducted a user study of 15 participants who corrected an ASR transcript with and without confidence shading (in this case, highlighting). The results showed that correction with confidence shading took slightly longer than without, although this was not statistically significant. Conversely, Burke, Amento, and Isenhour (2006) reported that in their user study of 16 participants, most agreed that confidence shading was helpful for identifying mistakes in the transcripts. One notable difference between these studies is that Suhm, Myers, and Waibel (2001) optimised their confidence threshold to minimise the overall accuracy of the confidence shading, whilst Burke, Amento, and Isenhour (2006) increased the threshold to treat false negatives more seriously.
Vemuri et al. (2004) studied whether confidence shading improved comprehension of the transcript. They conducted a user study of 34 participants and measured the comprehension of short audio clips when using ASR transcripts with and without confidence shading. Although the results indicated better comprehension with confidence shading, there was no statistically significant difference.
2.5 Audio playback interfaces
The previous work we have considered so far has used audio visualization and transcripts to represent audio content. Visual presentation of audio content makes it easier for users to search and skim the information, but it is difficult, if not impossible, for humans to fully comprehend sound using visual means. Listening is the natural way for humans to consume audio content, but the time required to listen can make it a lengthy and inefficient process.
As we shall see in this section, audio processing can be used to increase the speed at which users can listen to audio recordings. Through our literature review, we found that previous research has used two main techniques to achieve this. The first uses processing to improve the comprehension of speech at higher playback rates. The second exploits the “cocktail party effect” by playing multiple audio streams simultaneously and using audio processing to help the listener separate the sounds. We discuss each of these techniques below.
2.5.1 Time compression
Listening to long audio recordings of speech can be time-consuming. A simple way to reduce the listening time is to increase the rate of playback. However, this increase in speed causes an upward shift in the pitch of the sound, which is sometimes described as sounding “like chipmunks” (Vemuri et al. 2004; Ranjan, Balakrishnan, and Chignell 2006). The increased speed with which the content is presented also makes it difficult for listeners to process the information fast enough.
In this field, intelligibility is defined as the ability to identify words, and can be measured by the accuracy with which a specific word is recalled. Comprehension is defined as the ability to understand the content of the material, measured by the number of correctly answered questions about the subject matter (Foulke and Sticht 1969). The change in pitch caused by speeding-up audio negatively affects both the intelligibility and comprehension of speech (Arons 1997).
There are several approaches for reducing the time required to listen to a recording while being able to extract critical information, which can be divided into two categories. Speed-up techniques aim to increase the speed of playback without affecting the pitch of the speech, and excision techniques aim to remove parts of the speech in a way that minimises the reduction in comprehension (Arons 1997).
Tucker and Whittaker (2006) performed a user study that compared two different excision techniques and a speed-up technique, using both 5-min and 30-min audio recordings. Participants ranked a list of utterances to match what they heard, which was compared to a reference response to produce a score for comprehension. This score was normalised by the listening time to measure “comprehension efficiency”. The results showed that for short recordings, excision outperformed speed-up, but that they performed similarly for long recordings. However, when using excision, participants were less likely to switch to normal-speed playback, and they reported that they preferred excision to speed-up.
The simplest excision technique is to remove frames of audio at regular intervals, known as “isochronous sampling” (Arons 1997). However, this approach does not discriminate between valuable and redundant information. It also fails to take into account speech boundaries, so may cut the audio mid-way through a word. Shortening or removing pauses between words is a simple and effective approach that reduces the length of the audio whilst retaining all of the information and respecting speech boundaries. However, once all of the pauses have been removed, other techniques must be used to further compress the speech.
Many excision algorithms operate by segmenting the audio at points of increased saliency, then playing only the beginning of each segment before moving onto the next. The saliency can be determined by measuring pause length, pitch, speaker turns and using transcripts. Long pauses in speech often signal a new sentence, thought or topic, which can be an indication of importance. The pitch of the voice tends to increase in range when introducing a new topic (Hirschberg and Grosz 1992), which can be used as a measure of emphasis. Speaker diarization techniques (Anguera Miro et al. 2012) can be used to detect changes in speaker, which can be a cue for changes in topic. Transcripts of the speech have also been used with summarisation techniques to determine the most salient parts of the speech, using both ASR transcripts (Hori and Furui 2003) or manually-written transcripts (Tucker and Whittaker 2006).
SpeechSkimmer by Arons (1997) combined three excision techniques into a single time compression interface by switching between them for different rates of playback. He used pause shortening and removal for modest speed increases, followed by pause-based segmentation for faster playback. For the fastest playback rate, he used segmentation resulting from a pitch-based emphasis detection algorithm. He evaluated the system through a qualitative study of 12 participants, which compared two systems that used different algorithms for the fastest playback rate — one using pitch-based emphasis segmentation and the other using isochronous sampling. The participants reported that pitch-based emphasis was effective at extracting interesting points, and performed better than excision using isochronous sampling.
There are limits to how far time compression can be used to increase playback speed. For example, speed-up techniques are only intelligible up to a maximum of around \(2\times\) to \(2.6\times\) real-time (Vemuri et al. 2004; Tucker and Whittaker 2006; Ranjan, Balakrishnan, and Chignell 2006; Arons 1997). However, transcripts can be used in combination with time compression to increased this maximum rate. Vemuri et al. (2004) conducted a user study of 34 participants and measured their comprehension of short audio clips at different rates of playback using speed-up. The mean self-reported maximum playback rate was \(2.6\times\) real-time for listening only. The addition of an ASR transcript increased this to \(2.8\times\), and a verbatim transcript increased this further to \(3.0\times\). Whittaker et al. (2002) exploited this by including time-compressed playback in the SCANMail semantic speech interface.
2.5.2 Simultaneous playback
The cocktail party effect is “the ability to focus one’s listening attention on a single talker among a cacophony of conversations and background noise” (Arons 1992). This effect can be exploited to help listeners find a particular piece of audio in a recording by playing different parts of that recording simultaneously. To help listeners separate the sounds, previous work has experimented with using headphones to play different sounds in each ear, or using binaural audio to spatially separate the sounds.
AudioStreamer from Schmandt and Mullins (1995) used binaural spatialization techniques to play three simultaneous audio streams of broadcast news around a listener’s head. The system tracked the movement of the listener’s head to boost the level of the stream they were facing as they turned. In addition, they used pause-based segmentation and speaker diarization to alert the listener to new stories using a short bleep sound. No user studies of AudioStreamer were conducted.
Dynamic Soundscape from Kobayashi and Schmandt (1997) also used spatialization to help users navigate audio files by mapping the sound to fixed positions a virtual soundscape. The system was designed to take advantage of human abilities for simultaneous listening and memorising location. Users would start by listening to a virtual “speaker” that played the audio while slowly orbiting their head in a clockwise direction. Audio could be replayed by pointing their hand at the location where it was originally heard, which would create a second speaker that played from that position. Similarly, users could skip ahead by pointing to a position ahead of the original source. Speakers could be grabbed and moved, and an audible “cursor” allowed users to hear where they were pointing. Through informal feedback, users suggested that they could use their spatial memory to navigate the audio. Based on their observations, the authors suggested that the system could also help with transfer to long-term memory.
Ranjan, Balakrishnan, and Chignell (2006) attempted to reduce the time needed to search an audio recording by using dichotic presentation, where different sounds are played into each ear. In their system, the left ear played from the beginning of the recording while the right ear played from the half-way point. Through a user study of 13 participants, they tested the effectiveness of this approach for a search task. The results showed that dichotic presentation reduces the overall search time compared to normal audio playback, particularly when the answer is in the second half of the recording. The overall time reduction was around 20%. Dichotic presentation can be combined with time compression, but this creates high cognitive load and 8 of the 13 participants reported it to be “very demanding”.
2.6 Research questions
In this chapter, we described the context of our research topic by introducing audio editing, semantic audio analysis, audio visualization, semantic speech interfaces and audio playback interfaces. We are now in a position to reflect upon our aim (Section 1.2) and the literature to formulate the research questions we want to address in this thesis.
In Sections 2.2, 2.3, 2.4 and 2.5, we introduced a variety of methods and technologies that could potentially improve interaction with, and manipulation of, recorded audio. However, it is unclear which of these are most appropriate or most effective for radio production.
Question 1: How can radio production be improved with new technology for interacting with and manipulating recorded audio?
In Section 2.1.2, we saw how DAWs use audio waveforms for the navigation and manipulation of audio content, but that there are limitations to this approach. Despite their widespread use, the author could not find any studies that attempted to measure the performance of audio waveforms. Section 2.3.2 described several promising methods for enhancing audio waveforms by using colour to add semantic information. However, the author could also not find any formal evaluations of these methods.
Question 2: What is the role and efficacy of audio visualisation in radio production?
In Section 2.4, we saw how user studies from Whittaker and Amento (2004; Yoon et al. 2014; Sivaraman, Yoon, and Mitros 2016) found that semantic speech editing is faster and more accessible than waveform editing, and easy to use. However, these systems were designed for navigating and editing voice messages and spoken comments, which use a different style of audio content and have different requirements than radio production. Rubin et al. (2013) demonstrated a system for the production of “audio stories”, which has many similarities to radio production, but this system was not formally evaluated, so it is unclear what effect semantic editing has on the radio production process.
Question 3: How can transcripts of speech be adapted and applied to radio production?
To be able to answer these questions, we first need to have a solid understanding of the radio production process. Despite the large scale of radio production activity around the world, the author could only find two studies that involved radio producers (Dunaway 2000; Barbour 2004), both of which were written by radio producers working in academia. This shortage of studies may be a result of the limited number of radio producers, and their demanding workload, which can make it challenging to recruit them for academic research. For example, Kim, Oard, and Soergel (2003) worked with National Public Radio (NPR) to develop a speech archive interface, but reported that they were unable to recruit any radio producers to evaluate their system due to the small population and their limited availability.
The author of this thesis is an employee of BBC R&D, which gives us access to the resources of BBC Radio. This is unusual in academic research, where studies are often conducted with student participants and under laboratory conditions. We want to exploit our position within the BBC to be able to capture and share information about how radio programmes are produced.
In Chapter 3, we begin our research by conducting three ethnographic case studies of production practice within BBC Radio. The results of this study will allow us to be better informed about the tasks and challenges involved in production, which will guide our research direction and design choices. This study will also allow us to take advantage of access available to us that other researchers would not have. Once we have gained a better understanding of the processes and challenges of radio production, in Section 3.5 we will reflect upon our findings and our research aim to determine a research strategy for achieving our goal.
3 Audio editing workflows in radio production
In pursuit of our ambition to develop better methods for radio production, we want to begin by selecting the aspects of production on which we should focus our research. This will reduce the scope of the problem and allow us to concentrate our effort on the area that will create the greatest impact. However, this decision requires a solid understanding of the workflows involved in the production of radio, and the challenges radio producers face in their roles.
There are two classic books that document the radio production process. McLeish and Link (2015), now in its sixth edition, provides a broad overview of the practice of radio production with an emphasis on editorial, organisational and business concerns. Hausman et al. (2012), currently in its ninth edition, covers the more practical aspects of radio production including the use and operation of tools and equipment. Despite the valuable contribution of these publications, they present a high-level overview of production practice that does not fully address the real-life challenges and issues that radio producers face in the industry. We want to understand the specifics and complexities of the radio production process, so that we may gain insights into the authentic challenges producers face in creating audio content.
There are many semantic audio and user interface technologies that have the potential to support producers in the challenges faced when producing radio content. Speech/music discrimination (Wieser, Husinsky, and Seidl 2014), speaker diarization (Anguera Miro et al. 2012), speaker identification (Lee, Soong, and Paliwal 1999) and automatic speech recognition (Junqua and Haton 1995) can all be beneficial for use in radio systems (Raimond et al. 2014; Bell et al. 2015). However, without a detailed understanding of the production process, it can be difficult to know which of these technologies have the most potential, or how they can best be applied to the workflow. We would like to use our understanding of semantic audio and user interface technologies to discover which of these can best be usefully applied to the challenges of radio production.
The BBC is the world’s biggest broadcaster by number of employees, with over 21,000 full-time staff (BBC 2017, p. 56). It operates ten UK-wide radio networks, six regional services, and 40 local radio stations, in addition to a global radio service in 29 languages, with over 154M listeners per week (BBC 2017, pp. 4-32). As discussed in Section 2.6, we want to exploit our position within the BBC to be able to capture and share information about the radio production workflow. We hope this might allow other researchers to use what we learn to guide their research to maximise the benefit to the radio production community.
To help us better understand the radio production process, we conducted three ethnographic case studies of production practice within BBC Radio. Section 3.1 outlines the design of our study, Section 3.2 presents the results of each of our case studies, we discuss our findings in Section 3.3, and present our conclusions in Section 3.4. Finally, in Section 3.5, we reflect upon what we learned, and the previous research that has been conducted, to determine an intervention strategy for achieving our research aim.
3.1 Methodology
The objective of our study was to document the radio production workflow, and to identify opportunities for making improvements through the application of semantic audio technology. In addition to making the production process more efficient, we were also interested in finding ways to improve the quality of radio programmes, and to facilitate the creative process of producing audio content. We were interested in using these opportunities to guide the direction of our research, and to help us decide on an intervention strategy for achieving our research goals.
Most radio content is broadcast live. In these cases, the content is produced in real-time, so there is no opportunity to produce the programme any faster. However, many types of programmes, such as documentaries and drama, are pre-produced using audio editing software. Here, the production process is many times longer than the programme, so there are opportunities to make the production process more efficient. For this reason, we chose to focus on studying the production of pre-produced radio programmes.
3.1.1 Data collection
We wanted to exploit our position of working within the BBC by collecting our data through a workplace study at BBC Radio. In their book on workplace studies, Luff, Hindmarsh, and Heath (2000) argue that “it is important to observe and analyse work as it occurs” and criticise the use of interviews and questionnaires. They point out that a researcher cannot know in advance what the right questions are to ask participants in an interview, and often there is a difference between what participants believe they do and what they actually do. As Luff, Hindmarsh, and Heath (2000, p. 245) note, “many activities are performed repeatedly and become tacit in nature; they are seen but not noticed”.
We chose to use direct observation to collect our data, where we witnessed radio production first-hand without taking part. Producers are very busy and direct observation allowed us unobtrusively to collect the data without adding to the producer’s workload. Additionally we could observe the real-world process, as opposed to a theoretical or reported one, and take into account the context of the working environment.
Some studies have successfully used video recording to capture and analyse interactional organisation in the workplace, which can provide insights into communication and collaboration (Luff, Hindmarsh, and Heath 2000, p. 16). We were not able to take this approach for our study as the observation took place at the BBC, whose policies prevented us from using video recordings in the workplace. This policy exists to protect the staff’s privacy and any sensitive information, which is often handled by journalists. Rather than disrupting the workflow and environment of the production team to use video recording, we recorded the observational data by writing field notes. In addition to observation, we used free time between activities to conduct ad hoc, in situ interviews to clarify the participant’s workflow and decision-making process.
Due to the scale and variety of the radio operations at the BBC, it would be impossible to cover all production genres and techniques. To limit the scope of our work, we followed a “maximum variation sampling” strategy (Patton 1990, p. 172) to choose a small number of heterogeneous case studies. We selected programmes of different genres to cover a variety of cultures and work practices.
The time needed to produce programmes can vary significantly, with some being produced over many weeks or months. To reduce our observation time, we worked with each production team to create a schedule of observations that sampled every stage of the process and every role in the team. This allowed us to capture the entire workflow without having to be present throughout.
3.1.2 Recruitment
We recruited participants using an invitation email sent to BBC R&D’s contact list of Studio Managers working in BBC Radio. Through this process, we recruited three production teams who create the following programmes from the departments listed:
Hourly news bulletin (Radio Summaries, BBC News)
“15 Minute Drama” radio drama (London Radio Drama, BBC Radio)
“The Report” documentary (Radio Current Affairs, BBC News)
These three programmes (news report, drama, documentary) fulfilled our criteria for a heterogeneous sample of programmes from different genres.
3.1.3 Procedure
We used a single researcher to collect the data for our study through direct observation. The researcher observed the production of each programme from the beginning of audio recording/collection, to the point where the audio had been finalised. The observation did not focus on a single member of the team, but covered the entire team that contributed to the audio production. This allowed us to study the different roles involved and how they interact. The production teams were observed in their normal place of work. This allowed us to take into account the context of the environment in which the teams work, both in terms of the physical location and layout, and of the tools and software they use to perform their tasks.
We worked with each production team to design a schedule of observation that would cover the entire production process. Each programme required a different amount of time. Observing the news bulletin took half a day, the drama took two days, and the documentary took four days. When the team members were not busy, the researcher used ad hoc, in situ interviews to ensure they understood the reasons and motivation behind the producer’s actions.
The researcher used a laptop computer to type field notes throughout the observation. The notes specifically included the following:
Roles — Who are the team members? What are their responsibilities? Which other teams are involved?
Environment — What is the location? How is the physical space laid out?
Tools — Which tools are used? For what purpose? How do the users operate them?
Tasks — What tasks are involved? Who does what? In what sequence do they take place?
Challenges — Were there any problems or frustrations? Which activities were demanding or mundane?
The researcher also took photographs of any relevant locations, tools or other items, with the permission of the participant.
3.1.4 Analysis
We used the observation notes to populate a list of roles involved in the production and wrote a description of each of their responsibilities. We wrote a description of the working environment in which the production took place, including the location, the tools that were used, and how they were used. We also drew a map of the physical environment, including the spatial layout of the team members.
We used hierarchical task analysis (Kirwan and Ainsworth 1992; Annett and Stanton 2000) to deconstruct the production process into a sequence of individual tasks. We assigned each task to the role that was responsible and the location in which it took place. We then used a partitioned operational sequence diagram (Kirwan and Ainsworth 1992) to graph the sequence of tasks in chronological order, arranged into columns to indicate the role and location.
Finally, we identified any challenges that were noted by the researcher, and wrote a description of the current approach and any suggested improvements that could be made.
3.2 Study results
In this section, we present the results of our three ethnographic case studies. For each study, we describe the roles and responsibilities of the team members, the environment and tools that were used, the results of the task analysis we performed, and list the challenges we identified.
3.2.1 News bulletin
The Radio Summaries team at BBC News (known as “Summaries”) write most of the hourly news bulletins for most of the national radio networksThe 6pm and 10pm bulletins, and all of the bulletins for Radio 1, 1Xtra, Asian Network and Radio 5 are not written by Summaries.
. The bulletins written by the Summaries team are read live on-air by a Newsreader at the start of every hour. The researcher observed the team for five hours during a morning weekday shift, from 7am to midday. The pace of work in the team was so fast that there was little time to talk to the participants to ask any questions, so the results are mostly based on direct observation.
3.2.1.1 Roles and responsibilities
Summaries is run by an Assistant Editor who leads between two and four Broadcast Journalists. The team work 24 hours a day on three eight-hour rolling shifts to report breaking news stories and their developments throughout the day.
The role of each Broadcast Journalist is to select and write a series of short text summaries of the day’s news stories for a given radio network. They enhance the summaries by finding, editing and inserting audio clips of reports or interviews. Broadcast Journalists produce one bulletin per hour, each between two and five minutes long, with between four and six stories per bulletin. The length of the bulletin and number of stories depend on the network and the time of day. For example, Radio 4 bulletins are longer than other networks, and midday bulletins are longer than those at other times. Even if the stories being covered are the same, the bulletins for each network are written separately so that they are targeted to the audience of that network. This is done by varying the language, tone, amount of detail and level of assumed knowledge.
The Assistant Editor is the team leader and they assign the responsibility for each radio network to a Broadcast Journalist. However, they also perform the same role as the Broadcast Journalists. Throughout the day, the Assistant Editor keeps track of the news stories that are developing and decides which of these should be included in the bulletins. Sometimes they will commission a Reporter to record a news report to include in the bulletins. The Assistant Editor reads and approves each bulletin written by the team to check that they are appropriately worded, have been fact-checked, and comply with the BBC’s editorial guidelines. The Assistant Editor aims to have the bulletins approved about 15 mins before the hour, but often new developments mean that bulletins are being edited at the last minute. Once approved, the finished bulletins are read out live by a Newsreader in a radio studio, who generally has no direct contact with the rest of the team.
The Summaries team gather audio content by working with the Intake team and directly with Reporters. The Intake team set up and record live incoming audio and video feeds from Reporters in the field. They use an intercom to notify Summaries of the incoming feeds so that they can listen-in to the live feeds and provide instant feedback to the Reporter. Summaries also work directly with individual Reporters that have been commissioned to record clips for the bulletins. These are recorded and edited by the Reporters themselves and provided to the team directly.
3.2.1.2 Environment and tools
The Summaries team sit together at a single desk in the BBC newsroom at New Broadcasting House in London. When it opened in 1932, Broadcasting House was the first purpose-built broadcast centre in the UK (Hines 2008). Following a major expansion between 2003 and 2013, Broadcasting House now contains 35 radio studios from which 30 domestic and World Service radio stations are broadcast, and is the workplace for 6,000 staff (BBC News 2013). Figure 3.2.1.2.1 shows the newsroom and Figure 3.2.1.2.2 shows the location of the team within the space. The BBC newsroom is the largest in the world and is supported by some 3,000 journalists (McLeish and Link 2015, p. 80). The newsroom houses teams from around the BBC News division and is spatially arranged to facilitate the fast flow of communication. The teams for each platform (e.g. TV, radio, online) sit together at desks that fan out from a central area. Decisions on which stories to cover are made in this central area, and are communicated outwards.
Figure 3.2.1.2.3 shows an example of the desks used by members of the Radio Summaries team. The desk includes an intercom that can be used to communicate with other teams using labelled “push-to-talk” buttons. A desktop TV monitor is used to keep an eye on the 24-hour BBC News television channel, to track which stories are currently being reported. Most communication is within the team, which is helped by sitting close together at the same desk.


The Broadcast Journalists and Assistant Editor write the summaries on a desktop PC using a software package called “Electronic News Production System” (ENPS). Figure 3.2.1.2.4 shows the ENPS interface. ENPS is used for writing scripts, compiling and approving news bulletins, and monitoring newswire servicesNewswire services are global news agencies that provide news reports to subscribing news organisations, such as Reuters and Associated Press (AP).
. The system is networked so that any changes made in ENPS are instantaneously updated for everybody. Audio clips are browsed, imported and edited using a plugin called Media Object Server (MOS), which integrates with the dira! radio production system.
When Intake upload a clip to dira!, it appears on a large screen in the news floor called the “arrivals board” (see Figure 3.2.1.2.5). The display includes a reference number which can be used to find the clip, as well as the upload time and a description. The description often contains the subject, reporter’s name and their location, but the descriptions are written quickly and there is no formal syntax.
3.2.1.3 Task analysis
Figure 3.2.1.2.6 shows the operational sequence diagram of the Radio Summaries production process. A description of the workflow with labelled tasks is presented below.
The Assistant Editor selects which news stories should be included in the bulletins (1). The stories come from multiple sources, including newswire services and the BBC television news channel. Newswire reports are accessed through ENPS, and users are notified of any reports flagged as important (2). As they work, the Assistant Editor and Broadcast Journalists use their desktop monitor to keep an eye on the BBC News TV channel to spot any breaking news stories, or material which they could use in their bulletins, such as interviews (3). The Assistant Editor will sometimes commission a Reporter to record a news report for a particular story to ensure that they have good audio content to include in the summary (4). The Broadcast Journalists and Assistant Editor both write the summaries for a specific bulletin using ENPS (5). Previously-written summaries are often re-used, but are updated to reflect the latest information.
Audio clips are added to each summary to include quotes from interviews and items from Reporters. The audio is sourced from the Intake team, directly from Reporters and from the BBC News TV channel. Audio from Intake (6) and Reporters (7) is imported using the MOS plugin. The plugin allows users to find audio in the dira! radio production system and edit clips by cutting the audio, and controlling sound levels/fading (8). Audio from the BBC News TV channel must be found and clipped by the Broadcast Journalist themselves. The sound from the television channel is automatically recorded into dira! in 40-minute segments. The Broadcast Journalist uses the MOS plugin to browse to the desired segment, find the location of the audio they want, and create a clip of the audio. Finished clips are inserted directly into the text of the written summary using a drag-and-drop gesture (9). At this point, the Broadcast Journalist gives the clip a name and can optionally include the “in/out words” that are spoken at the start and end of the clip. The name, in/out words and duration of the clip appear in the script.
The finished bulletin must fit an exact time slot (e.g. 120 seconds), so the Broadcast Journalist must estimate how long it takes to read their bulletin, including the audio clips, and edit the text to the correct length (10). When a Journalist has finished writing their bulletin, it is placed into the “running order” (11) and named according to the network and time (e.g. “R4 Thu 10:00”). The Assistant Editor then reviews the bulletin and listens to the clips (12). This is to ensure the bulletin is of the right length, is factually accurate, uses the correct language, and complies with BBC editorial policy. Any required changes are made either by giving feedback to the Journalist (13), or by the Assistant Editor making the changes themselves (14). When the item is approved in ENPS, it is labelled with a green flag, which indicates that it has been signed-off (15).
The Newsreader sits in a radio studio and normally has no direct contact with the Summaries team. At the time of the news bulletin, the Newsreader reads the script directly from ENPS while on-air (16). The audio clips in the script are automatically loaded into the play-out system, and the Newsreader uses a button to trigger them at the right time. The duration and in/out words of the audio clip are displayed in the script, which helps the Newsreader to predict when the clip will end.
3.2.1.4 Challenges
The Summaries team work under high-pressure circumstances. They have less than an hour to put together several minutes of content that will be read to millions of listeners. News can break at any moment, so sometimes bulletins need to be changed or re-written minutes before they are broadcast. In addition to these pressures, it is very important that the news reports are factually accurate and balanced. Due to these circumstances, the participants had very little time to talk to the researcher. During observation, all of the communication between team members was directly related to the task at hand, and there was no chatting or socialising.
When creating clips from television broadcasts, the journalists must source the clips from 40-minute-long segments. To find the audio, they clicked on a waveform to navigate the recording and listened for a particular voice or mention of the topic of interest. The MOS plugin interface they used displayed an audio waveform, but this did not seem to help them find the audio. Finding and cutting clips in this way is a time-consuming and difficult task, particularly when performed under pressure. Application of speaker diarization or automatic speech recognition (ASR) technology could help by indicating when different people are speaking, displaying keywords that are mentioned, or allowing the recording to be searched as text.
The bulletins written by the Broadcast Journalists must target a specific duration for when they are read. They have no indication of how long it takes to read a piece of text. They must therefore estimate this based on experience, or reading it in their head. By developing a system that estimates the duration of spoken text, Broadcast Journalists may be able to target a specific duration more efficiently.
When it comes to inserting clips into the script, in and out words must be manually entered so that the clip can be recognised in the text. Ideally this text would include a full transcription, but there is not enough time to transcribe the whole clip. ASR technology could be used to help automate this and full transcription could further help the journalists to recall the clip and write the script around it.
3.2.2 Drama
Radio 4’s “15 Minute Drama” is a series of original drama and book dramatisations, broadcast twice-daily. Drama production is very different from most other genres in radio, as it is based on a pre-written script of a radio play. Each episode takes around two days to produce, but production of the series spans several weeks. The researcher observed the production over two full days — one for the recording of the drama and the other for the editing process. The observation did not include the writing of the script.
3.2.2.1 Roles and responsibilities
The production team is led by a Director who works with a Broadcast Assistant and three studio managers (SMs) — a Panel SM, Grams SM and Spot SM. The team record a cast of actors who perform the drama.
The Director is responsible for leading the team and making editorial and creative decisions. Before the recording, they will have commissioned a writer to create the script, and worked with them to refine it. During the recording, they announce the start and end of takes, give feedback to the cast about their performances, and work with the SMs to ensure the drama has the right sound.
The Director is supported by a Broadcast Assistant who handles much of the administrative work before and after the recording, such as making copies of the script, booking the cast, producers and rooms, and processing payments. During the recording, they annotate the script with detailed notes about the position and length of each take, and mark any mistakes or re-takes.
The Panel SM is responsible for the sound of the drama. They lead the other two SMs during the recording process, operate the mixing desk in the cubicle and make backup recordings of the performances onto CDs. They also work with the Spot SM to position the actors and microphones to achieve they sound they want. After the recording, they work with the Director to edit the drama into the final version.
The Grams SM prepares and plays pre-recorded sound effects during the recording, and is also responsible for recording the performances using a DAW. “Grams” refers to gramophones, which were historically used to play pre-recorded sound effects. After each take, the Grams SM labels the recording with the episode, scene and take numbers, which are later used to assemble the final programme. When the Director wants to listen back to a performance, the Grams SM uses the DAW to find and replay the desired take.
The Spot SM works in the studio, where they set up and position microphones and create “spot effects”, also known as “foley” in the film industry. The effects are produced using a large variety of props that are kept in the studio to emulate common sounds such as doors, windows, locks, telephones and footsteps to name a few.
The cast are hired by the Director specifically for the drama being recorded. Often the cast are sourced from the BBC Radio Drama Company (RDC), which is a rotating group of actors that are employed by the BBC. The cast perform the radio play in the studio, working under instruction from the Director.
3.2.2.2 Environment and tools
The drama we observed was recorded in Studio 60A, which is a purpose-built flexible performance space at BBC New Broadcasting House in London. The studio contains various spaces with different acoustic properties, including a staircase with wood, concrete and carpet steps, an upstairs bedroom, a fully working kitchen and a foam-lined spiral corridor, used to simulate distance. There are many fixtures and a range of props for re-creating spot effects of common environmental sounds such as freestanding doors/windows with a variety of knockers and letter boxes. The studio is a large space, so there are four CCTV cameras which are used to help the producers in the cubicle to see parts of the studio that are out of sight.

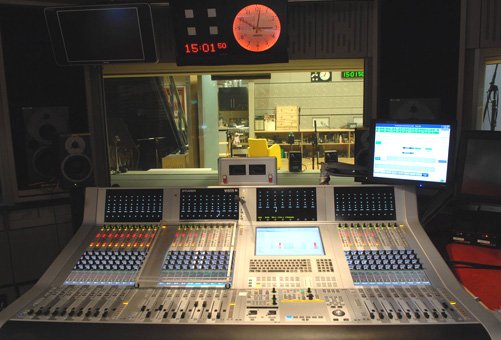
The studio is connected by a large acoustically-isolated window to the control room, known as the “cubicle”, where the production team sit. Figure 3.2.2.2.1 shows the layout of the two spaces and Figure 3.2.2.2.2 shows the view of the studio from the cubicle. The mixing desk is operated by the Panel SM and is positioned directly in front of the window. The Broadcast Assistant sits to the right of the Panel SM and the Director sits directly behind them. The Grams SM sits at the back of the room, while the Spot SM spends most of their time in the studio. The Director, Broadcast Assistant and Panel SM each have an intercom, which they can use to communicate with people in the studio with a “push-to-talk” button.
The Panel SM sets the sound levels and balances the audio using the mixing desk, and makes a backup recording of the performances using a CD recorder located in a rack to the left of the mixing desk. Under the mixing desk, there is a foot pedal which controls a light in the studio, known as a “cue light”, to silently indicate the start of a performance. The Panel SM also controls warning lights displayed above the door to the studio to stop people from walking in during recording. The Grams SM uses software called “SpotOn” (Cridford 2005) to select and play pre-recorded sound effects. They use the ProTools DAW to record audio clips of each performance, and label them with the episode, scene and take numbers.

Figure 3.2.2.2.3 shows the editing suite where the Panel SM and Director perform the post-production work. The editing suite is a compact acoustically-treated room which houses a PC running ProTools, stereo speakers, a small mixing desk and level meters. The left monitor is used to find pre-recorded sound effects and the right monitor is used to arrange and edit the audio clips. The Panel SM uses an annotated copy of the script to guide this process.
3.2.2.3 Task analysis
Figures 3.2.2.3.1 and 3.2.2.3.3 show the operational sequence diagrams of the radio drama recording and editing processes, respectively. Descriptions of each workflow with labelled tasks are presented individually below.


Recording The recording process involves the entire production team and cast. The Broadcast Assistant co-ordinates the team members by organising the recording date, and booking the studio and cast (1). Between one and two episodes are recorded in a day. Prior to recording, the cast will assemble in the “green room” with the Director and rehearse the play (2). During the rehearsal, the Broadcast Assistant measures how long the performances take (3), to ensure they are not too long or too short. The Director provides feedback to the cast on their performances (4) before they move to the studio (5). The Grams SM sets up the studio by arranging acoustic panelling, preparing props and arranging microphones (6). In the cubicle, the Panel SM sets the sounds levels of the microphones (7), and the Grams SM selects and loads the sound effects that will be played during the recording (8).
The drama is recorded as a series of “takes”. Each take is a short segment of a scene, often only 20–30 seconds long. Multiple takes of the same material are recorded so that the Director can give feedback to the cast between takes. The Director starts the recording process by announcing the episode, scene and take number (9). The Panel SM starts the backup recording (10), and the Grams SM starts the DAW recording (11). When everything is ready, the Panel SM flashes the cue light, which silently signals the cast to start performing (12). During each take, everybody listens to the performance (13). The Spot SM performs live spot effects in the studio (14), while the Panel SM balances the audio levels (15), and the Grams SM triggers pre-recorded sound effects (16).
The Broadcast Assistant annotates a printed script with information about each take (17). Figure 3.2.2.3.2 shows an example of an annotated drama script. The start and end of each take is marked with a vertical line on the side of the page. The take and backup CD numbers are written at the top of each line, and the duration of the take is written at the bottom. If the take starts again during a recording, the line continues back to the top. The best take for each scene is marked by highlighting the line for that take. Words that are spoken incorrectly are underlined, and repeated words or phrases are marked with square brackets. Different coloured pens are used to distinguish the marks for each take.
At the end of a take, the Panel SM stops the backup CD recording (18) and the Grams SM stops the DAW recording (19). The Grams SM uses the DAW to label the clip with the episode, scene and take number — for example, “e2s3t1” (20). The Broadcast Assistant marks the printed script and spreadsheet with the length of the take and the backup CD number (21). If the Director wants to record another take (22), they discuss the performance with the production team, then provide the cast with feedback, either by walking into the studio, or using the intercom (23). If the Director is satisfied that they have recorded what they need, then they select the best take and move onto the next scene (24). The Broadcast Assistant marks the best take on the script and spreadsheet, which calculates the current overall duration of the recording (25).
At the end of the episode (26), the team either move on to the next episode, or the Director sends everybody home (27). The Grams SM copies the audio clips from the DAW onto a portable hard drive (28). Portable hard drives are used as they can handle large file sizes better than than the local computer network. The hard drive and annotated drama script are given to the Panel SM to use for editing.

Editing The recordings for the drama are edited into a final programme by the Panel SM and Director. The Panel SM starts by creating a rough edit of the programme by themself, using the annotated script as a guide. As the files are stored on a portable hard drive, this process can be done either in an edit suite or on a laptop at home. The first step is to import the audio files (1) and create a sequence of the best takes from the recordings, as marked in the annotated script, by dragging them onto a time-line from the list of labelled clips (2). The Panel SM uses the script to identify and remove errors in the takes, such as re-takes or repeated words (3). They adjust the sound level to be consistent throughout by using the mouse to draw level curves, or by recording automation using a fader on the mixing desk (4).
The Panel SM adds any additional sound effects (5) using an effects library on their PC, which contains roughly 900 hours of sound effects. The effects are found either by using text to search their metadata, or by browsing to specific collections of effects. Before the Director joins them, the Panel SM listens through the rough edit (6) to identify any mistakes or errors, such as repeated words and phrases, or noise caused by actors handling their paper scripts. Double-speed playback is used to save time during this process. Any errors that are identified are fixed before moving on to the next stage (7).
Once the rough edit is complete, the Director joins the Panel SM in the edit suite. They listen to the rough edit to judge the quality of the performances they previously selected as the best takes (8). Often, the Director will ask the Panel SM to play other takes so that they can compare them (9). To do this, the SM finds the correct recording in the clip list, drags it onto the time-line and finds the correct position in the clip. The Director may ask the Panel SM to swap a take, or combine the start and end of different takes to use the best performances (10). The same process happens for the sound effects (11), which may be swapped or mixed together (12).
Music is not specified in the script, so the Director has the freedom to choose what they want (13). Popular consumer music services such as iTunes are used to find commercial tracks, but often Directors will choose “production music”, which is designed for TV/radio and is easier to license. These can be searched using descriptive keywords on one of a number of online music libraries such as Audio Networkhttps://www.audionetwork.com/
or Desktop Jukeboxhttps://desktopjukebox.broadchart.com/
. The Director provides the music to the Panel SM on a USB storage device for them to add using the DAW (14).
The final programme must have an exact duration to fit its assigned broadcast slot. The programme is often edited to be slightly too long, so some lines can be removed to reduce the programme length. Removing lines has a strong editorial impact, so the Director decides which lines to remove (15) and the Panel SM edits them out using the DAW (16). Once finished, the final edit is rendered to an audio file by playing the programme in real-time through a digital loop-back (17). Although this can be done faster, this playback forces the Director and Panel SM to listen to the programme from beginning to end in one go. If they are happy with the edit (18), the Director sends the file to their Editor for sign-off and broadcast (19).
3.2.2.4 Challenges
The clear syntax used to annotate the drama script shows that the production workflow is well-organised and makes good use of existing tools. However to convert those annotations into a rough edit, the SM must use a DAW to manually arrange and edit the clips, and remove any marked errors. The SM must use the audio waveform visualization to edit the clips. As it is difficult to identify the location of the words in the waveform, this can be a lengthy and tedious process. If the annotations could be captured digitally, the rough edit stage could conceivably be fully or partly automated.
In addition to being script-based, a defining characteristic of drama production is that multiple takes are recorded in order to capture the best possible performance. However, there is no simple way to directly compare performances. For this reason, the Director does not want to compare too many takes, and therefore relies heavily on the script annotations and written notes. Providing a quick and easy method for the Director to listen to and compare different takes could potentially lead to selection of better performances.
When actors make a mistake, they often say the line again immediately. This is usually marked in the script with square brackets. However, these can sometimes be missed and are not easy to spot using the DAW interface. Audio analysis techniques could be used to detect and highlight where this happens.
3.2.3 Documentary
“The Report” is a weekly investigative documentary that covers topical news stories. It is produced over a three week period by the Radio Current Affairs department in BBC News and is broadcast at 8pm every Thursday on Radio 4. The researcher observed the team for a total of four days — one day during their research phase, one day during their interviewing phase and two days during their editing phase.
3.2.3.1 Roles and responsibilities
The documentary is created by a team of three, made up of a Producer, Presenter and Researcher. At certain points during the production, the team is supported by an Editor and a Studio Manager.
The Producer leads the team and makes the editorial decisions. They decide what the story-line will be, who to interview and how the programme is edited together. They pre-interview participants to screen them, record interviews with them, transcribe those recordings and create a rough edit of the programme.
The Presenter is a journalist who is the narrator of the documentary. They work closely with the Producer to craft the story-line, write the narrative “links”, conduct interviews and provide feedback to the Producer about the edit. The Report has a regular Presenter who typically works on two or three documentaries at once.
The Researcher assists the Producer with research and investigation. They recruit for, and set up, interviews, conduct pre-interviews, and transcribe audio.
The Editor leads the Radio Current Affairs department. They do not participate directly in the production of the documentary, but provide feedback to the team and give approval for the documentary to be broadcast.
A Studio Manager (SM) joins the team on the final day of production to turn the Producer’s rough edit into the finished programme. This process includes recording the Presenter, removing redundant speech, adjusting the pace of the speech, removing unwanted noise and adding music.
3.2.3.2 Environment and tools
The team is based in BBC New Broadcasting House in London, where most of the work takes place in an open-plan office. This creates challenges for audio production, such as noise, privacy and reliance on headphones for monitoring (Brixen 2003). The research for the programme is desk based and does not require any special tools other than a web browser and phone.
Face-to-face interviews are conducted either on location, in the office building or in a radio studio. For interviews outside the studio, a portable audio recorder and microphone are used to capture the audio. Remote interviews are conducted by using an “ISDN”Integrated Services Digital Network
link to a local radio studio, an IP-based call such as Skype, or over the telephone. The telephone is used as a last resort as it has the poorest sound quality.
The office is located directly beside four radio studios. The studios are organised into pairs so that one can be used for recordings, with the other used as a cubicle. Each studio is acoustically treated and contains a PC with a DAW, a mixing desk, speakers, microphones and a telephone connected to a recorder. The studio is used to record remote and face-to-face interviews, record the Presenter’s narration, listen to the programme and edit it into the final version.
3.2.3.3 Task analysis
Figure 3.2.3.3.1 shows the operational sequence diagram of the documentary production. A description of the workflow with labelled tasks is presented below.
Production starts with researching the chosen topic of the documentary (1). The purpose of the research stage is to form the story-line for the documentary, and to identify people to interview. Often the topic will be in the news that week and the Producer will be looking for an interesting angle which can be explored in greater depth. The Producer and Researcher listen to news reports and documentaries, read newspaper articles and encyclopedias, and talk to contacts who know about the subject. The Producer makes rough notes for themself in Microsoft Word and prepares a draft outline of the programme (2).
Once the team have identified who they might want to interview, the Producer or Researcher will approach them to see if they are interested (3). If the interviewee has the time available, the Producer or Researcher will do a “pre-interview” over the phone, which simulates a real interview but is not recorded (4). This is done to see what the person will say and whether it suits the story-line of the documentary. Most interviews are recorded face-to-face, either on-location or in a studio, depending on the situation (5). During interviews, the Presenter asks the questions while the Producer records the audio and monitors the levels. For on-location interviews, the Presenter holds the microphone and the Producer operates the portable recorder (6).
All of the interview recordings are transcribed (7). Some recordings are sent to a third-party transcription service in Australia that transcribes the audio overnight. However, often the programme’s budget can only cover transcription of less than half of the interviews. The rest must be transcribed by the Producer or Researcher. For this, they use Microsoft Word to manually type the words. To save time, they will only do a rough transcription by skipping most words, leaving only enough to get a good idea of what was said. With both the third-party and manual transcriptions, timestamps are written every few minutes to help the reader identify the location of the audio.
The interview transcripts are printed onto paper, which the team use to help them collaborate face-to-face. The team go through the interview transcripts and mark with a highlighter pen lines that they want to use (8). Notes and labels are informally written on the page. After the team have marked-up the interview transcripts, the Producer uses them as a guide to find and create audio clips of the content they highlighted (9), and piece it together into a rough edit using a DAW (10). The timestamps written in the transcript are used to help them navigate the audio.

(\(^{*}\)some interviews are transcribed using a third-party service)
While the Producer creates a rough edit, the Presenter writes the programme’s “links” — the narrative elements that sit between the interview clips (11). When the first rough edit is complete, the whole team sits down with the Editor for a “run-through” (12). The programme is performed out loud from beginning to end, with the Presenter reading the links and the Producer playing the clips from the DAW. This allows the Editor to hear the programme and give early feedback. It also allows the Producer to determine the current length of the programme. This run-through process typically happens two or three times for each programme (13).
Once the Editor is happy with the rough edit, a Studio Manager (SM) is brought it to help turn it into the final programme. This often happens on the day of the broadcast. The Presenter records the links (14) with the help of the SM and the Producer who gives them feedback. The SM adds the links to the DAW in the correct positions (15). The Producer chooses any music that they want to add to the programme (16), often production music from an online library. The SM adds this music to the programme, along with the programme’s theme music (17). The SM cleans up the interview clips by removing redundant noises (e.g. “umm”) and phrases (e.g. “you know”), and ensures a good pace by removing long pauses (18). However, some redundant noises or pauses are left in because they are difficult to remove or editorially relevant. The SM also balances the sound levels by recording automation using a fader on the mixing desk or by dragging in/out fades.
Once all of the elements have come together, the Producer and SM work together to cut the programme down to a specific duration, in this case 27 minutes and 45 seconds (19). This is done by removing sections of speech, usually from the beginning and end of interview clips. The finished programme is played to the Editor for their approval (20), and any final changes are made by the Producer (21). Once the programme is signed-off, the documentary is rendered to an audio file and imported into the dira! radio production system. The Producer must then listen to the entire programme in dira! to ensure the audio that will be broadcast contains no errors (22).
3.2.3.4 Challenges
The documentary production relied heavily on printed transcripts, which allowed the team to collaborate and make notes. However, transcription is expensive if done using a third-party, and time-consuming if done by the team. Transcripts can give an idea of what was said, but it is difficult to navigate the audio to listen to how it was said. Rough timestamps are usually written every few minutes, which helps the Producer by narrowing the search area. However, they must use the audio waveform to find the specific word or sentence of interest. After the transcripts are annotated, the Producer has to go back and manually edit the selected parts of the interviews. The navigation process of timestamps and audio waveforms makes this a slow and tedious process. Creating a tighter link between the printed transcripts and the audio recordings would allow the Producers to work with transcripts as normal, but to simultaneously navigate and edit the audio content.
The Studio Manager used a DAW to manually remove redundant noises such as “umm”s. Finding and removing these noises is slow and difficult. If an acoustic model of redundant noises and phrases could be developed, these could either be highlighted for easier identification, or removed automatically.
3.3 Discussion
Our study investigated audio editing workflows in radio production using three ethnographic case studies. We identified three themes from the results of the study: waveform navigation, textual representation and the use of paper. We discuss each of these themes below.
3.3.2 Textual representation
We observed that in all three case studies, the producers interacted with audio using a textual representation. A script was used to refer to and mark-up the audio recorded in the drama. The documentary Producer transcribed all of their interview recordings, and used the transcripts for most of the production. The news bulletin producers also used text to label and insert “out-words” of the audio clips in their scripts.
Sound is a medium that must be experienced over a period of time, so listening to large quantities of audio can be slow. Representing audio using text allows users to quickly glance through and search audio content without having to invest time in listening. Text can be used to display word-for-word what was said, but it cannot display how it was said. The nuances of the spoken word can contain deeper meaning, which may not be visible in a written transcript. Despite this, the documentary Producer we observed chose to work with text rather than directly with the audio, which demonstrated that they found value in using a textual representation.
Generating transcripts of speech can be an expensive process. We saw that the documentary Producer could only afford to pay for transcription of less than half of their interviews, so had to transcribe the rest themselves, which took a long time and produced poor quality results. As we saw in Section 2.2.2.3, ASR could make this process faster and more affordable. We also saw in Section 2.4 that semantic speech editing interfaces can be used to edit audio content using a transcript-based interface. However, ASR transcriptions contain errors and it is not known how these would affect the usability of such transcripts in a radio production environment.
3.3.3 Use of paper
We saw that in both the drama and documentary productions, the teams used printed scripts or transcripts as part of their workflow. The two reasons we could identify for using paper rather than a screen interface were to make handwritten annotations, and to facilitate face-to-face collaboration. The drama production team used scripts to help them coordinate what they were recording, and to make annotations that were later used as a guide to edit the programme. The documentary Producer printed the transcripts of their recordings to help them collaborate face-to-face in deciding which parts to use, then marking their selections using a highlighter pen.
Paper is a flexible medium that can be handed around, pointed at and annotated freely, amongst other things. However, with both the documentary and drama, edit decisions that were written on paper had to be manually translated into audio edits using a DAW. This is a tedious and slow process. If these annotations could be captured in a structured digital format, they could then be automatically translated into audio edit commands. This may save producers time and effort without deviating much from their existing workflow.
3.4 Conclusion
We investigated audio editing workflows in radio production by conducting three ethnographic case studies in BBC Radio. The case studies covered production of a news bulletin, a drama and a documentary. Through direct observation, we documented the roles, responsibilities, environment, tools and challenges of each production, and used task analysis to deconstruct and graph the tasks of each programme’s workflow.
We observed that all of the radio producers navigated and edited audio using a waveform visualization. We saw that radio producers often work with textual representations of audio, rather than with the audio recordings directly, to help them search and navigate content more efficiently. The drama and documentary producers used paper scripts to make freehand annotations and facilitate face-to-face collaboration. We identified opportunities to assist the challenges of radio production using richer audio visualization, automated speech recognition and digitisation of paper annotations.
3.5 Intervention strategy
In this chapter, we described three ethnographic case studies that gave us insights into the challenges and opportunities that exist within the radio production process. We are now in a position to reflect upon our research aim (Section 1.2) and research questions (Section 2.6) to determine a strategy for achieving our goal.
Our investigation into radio production practice uncovered three themes. Each of these provide an interesting avenue of research to be explored. In this section, we describe our plan for investigating these individually through technical intervention.
3.5.1 Audio waveforms
In all of the case studies, producers used audio waveforms to navigate their audio content. As we saw in Section 2.1.2.1, waveforms display limited information which can make them difficult to use for navigation. However, despite their widespread use, the author could not find any studies that attempted to measure the performance of audio waveforms. Section 2.3.2 described several promising methods for enhancing audio waveforms by using colour to add semantic information. However, the author could not find any formal evaluations of these methods.
To answer our research question on the role and efficacy of audio visualization (see Section 2.6), we will perform a user study in Chapter 4 to evaluate the performance of audio waveforms and colour-enhanced visualizations. Our interest is in using audio visualization techniques to make the production of radio programmes more efficient. Therefore, we will design an audio visualization that uses colour enhancement to support a radio production task. We will evaluate our visualization using audio content that is representative of radio broadcasting, and measure the efficiency of users in completing the task using our visualization. Due to the lack of formal studies of both methods, we will not only compare our colour-enhanced visualization to normal waveforms, but also measure the performance of normal audio waveforms themselves.
3.5.2 Semantic speech editing
The producers in all three of our case studies interacted with audio content using textual representations. We also saw that the documentary producer wrote transcripts of all their interviews. In Section 2.2.2.3, we described how ASR can be used to automatically transcribe speech, and in Section 2.4 we saw that transcripts have been successfully used to allow for semantic navigation and editing of speech content.
As we discussed in Section 2.6, Rubin et al. (2013) demonstrated a system for the production of “audio stories”, which has many similarities to radio production. However, this system was not formally evaluated, so it is still unclear what effect semantic editing has on the radio production process. Other semantic editing systems have been formally evaluated (Whittaker and Amento 2004; Yoon et al. 2014; Sivaraman, Yoon, and Mitros 2016), but they were designed for navigating and editing voice messages and comments, which use a different style of audio content and have different requirements from radio production.
To answer our research question on how transcripts can be applied to radio production (see Section 2.6), we will investigate in Chapter 5 whether semantic speech editing can be used for radio production by designing and developing a semantic speech editor for radio production, and evaluating it through a user study. To ensure that the results relate to real-life requirements, we will use our access to BBC Radio to recruit professional radio producers, and evaluate semantic speech editing for use in production of genuine radio programmes. To measure its performance, we will compare semantic speech editing to the current production workflow.
3.5.3 Paper interface
In two of our three case studies, producers used paper scripts and transcripts as part of their production workflow. This allowed them to collaborate face-to-face and to describe their audio edits using annotations. The remainder of their production workflow was digital, and transferring between the paper and digital representations was a manual process. It may be possible to use technology to “bridge the gap” between paper and digital, which may have benefits to the radio production workflow.
This finding about the use of paper within radio production was unexpected, but provided an interesting new avenue for our research. This gave rise to an additional research question that we wanted to address in this thesis:
Question 4: What is the potential role of augmented paper in radio production?
In Chapter 6, we will investigate how augmented paper can best be applied to radio production, and develop and evaluate a system for producing radio content using a paper interface. To ensure that our system fulfils the real-life requirements of radio production, we will evaluate it for use in the production of genuine programmes by professional producers. We will compare this approach to a fully digital workflow by measuring our system against a similar screen interface. To understand the benefits of paper-digital integration, we will measure the performance of the system with and without the integration between the two.
4 Measuring audio visualization performance
An audio waveform is a plot of the amplitude of an audio signal over time (Hausman et al. 2012, p. 92). The amplitude profile of a waveform can be used to identify different tracks, see which parts are loud or quiet, and to identify errors such as clipping and unwanted noise. Users can also learn to read the cadence of speech, or even to spot certain consonants, but this requires experience and practice (Hausman et al. 2012, p. 115). As we saw in Section 2.1.2, audio waveforms are used in many digital audio workstations as a visual guide for navigating audio. We learned in Chapter 3 that the radio producers we observed relied on waveforms to navigate and edit audio content as part of the radio production process.
We saw in Section 2.1.2.1 that waveforms are limited in the amount of information they can display when viewed at different levels of zoom (J. Loviscach 2011b). The producers we observed in Chapter 3 used audio waveforms to navigate long audio recordings. To view a long recording on a screen, the waveform must be zoomed-out so that it can fit on the display. This reduces the resolution of the waveform, which means that frequency information and fine variations in the amplitude are no longer visible. Without this information, users cannot see the pitch, spectrum or timbre of the audio, which may reduce their ability to efficiently navigate and edit audio content. Despite the widespread use of waveforms in DAWs, we could not find any formal studies that have attempted to measure their effectiveness at navigation or editing tasks.
We saw in Section 2.3.2 that previous work has used semantic audio analysis to enhance audio waveforms through the use of colour. Rice (2005; Akkermans et al. 2011; J. Loviscach 2011a) used pseudocolour to map scalar values to a colour gradient to display information about the timbre of the audio. Tzanetakis and Cook (2000; Mason, Evans, and Sheikh 2007) used false colour to map audio feature vectors to RGB colour space to distinguish musical genres and navigate radio broadcasts. These systems demonstrated the potential of enhancing audio waveforms by mapping semantic audio features to colour. However, we could not find any formal user studies that attempted to evaluate the effect of this approach on navigation or editing tasks.
We were interested in examining how audio waveforms affect editing tasks in radio production, and whether enhancing audio waveforms with colour improves their performance. In Section 4.1 we describe the design of our user study, in which we measured the performance of users in completing an editing task using different audio visualizations. We present the results in Section 4.2, which show that mapping semantic audio features to colour improved user performance in our task. We discuss these results in Section 4.3 and present our conclusions in Section 4.4.
4.1 Methodology
In this study we aimed to discover what effect audio visualizations have on audio editing in radio production. We designed our study to measure user performance of a simple task, as this gave us a specific and repeatable action by which we could assess the effect of the visualizations. We wanted the task to be an activity that is common within radio production, and to use audio that is representative of that used by radio producers. However, in order to recruit enough participants, we chose a task that did not require radio production experience.
In this section, we first explain our approach to recruitment and choice of task, as this influences the design of our experiment. We then describe the test interface we designed, the test conditions, our selection of audio clips, the metrics used to measure performance, and our hypotheses. Finally, we present the protocol of our study and our analysis methodology.
4.1.1 Recruitment
The radio production community is relatively small. Producers are very busy and not used to participating in academic studies. We wanted to recruit enough participants for our results to be able to show statistical significance. Based on estimates from informal testing, we needed at least 40 participants. To get enough respondents, we chose to recruit technology researchers with experience in media technology and production, of which there is a much larger population. To attract enough participants, we designed our study so that it could be completed online, and in 15 mins or less. We used email distribution lists to advertise our study to everyone working at BBC Research and Development, and the Electronics and Computer Science department at Queen Mary University of London.
4.1.2 Task
In radio production, music has to be removed when turning a broadcast programme recording into a podcast. This is due to music licensing issues, which are different for downloadable content than they are for radio broadcasts. The music is removed by editing the audio in a DAW that uses a waveform to visualize the audio. Although the waveform can be used to allow users to distinguish between music and speech, at typical zoom levels it is not always visible. This means that removing the music can be a slow and tedious process. Therefore, we chose the task to be segmentation of music and speech.
4.1.3 Test interface
To conduct the experiment, we developed a web-based test interface, shown in Figure 4.1.3.1. The interface displayed the overall visualization as well as a zoomed-in view above it. The participant could navigate the audio by clicking on either view, which would seek to that position in the audio. Buttons below the visualization controlled play/pause, zoom level and setting the in and out points of the selection. The selection was displayed by highlighting both the visualization itself and a slider below it. The selection could be adjusted by dragging either end of the slider. Training was provided using a “pop-up tour”, which guided the user through the interface’s features and operation using a series of pop-up text boxes. The interface also captured the participant’s questionnaire responses and preferences.

We generated the visualizations of the audio clips using a plugin framework we developed called “Vampeyer”, which mapped the results of audio analysis plugins to a bitmap image. We then integrated those images into our test interface by developing an interactive web-based audio visualization library called “BeatMap”. We describe Vampeyer and Beatmap in greater detail in Appendices A.2 and A.3.
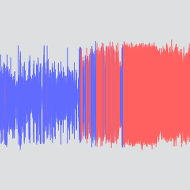
4.1.4 Conditions
As we saw in Section 2.1.2, radio producers edit audio with DAWs that use audio waveforms as the medium for interaction. In Section 2.3.2, we also saw that by adding colour to audio waveforms, additional semantic information about the audio could be displayed, while retaining the familiar audio waveform visualization. We were interested in measuring the performance of both the normal audio waveform and a semantically enhanced waveform, and also comparing them directly. Therefore, we chose to use the following conditions for the audio visualizations. An example of each condition is shown in Figure 4.1.3.2.
None: No visualization, audio only.
Waveform: Audio waveform in a single colour.
Enhanced: Audio waveform with colour mapped to low energy ratio.
We included a condition in which there was no visualization (C1) to use it as a baseline to measure the performance of the normal waveform. For this condition, the participant must rely purely on listening to the audio. For the other two conditions, they are able to both listen and use the visualization.
For the enhanced visualization, we extracted an audio feature that was relevant to the task and mapped it to the colour of the waveform. Speech-music discrimination (SMD) is a research topic that aims to automatically segment speech and music. This research often targets recordings of radio broadcasts (Goodwin and Laroche 2004; Wieser, Husinsky, and Seidl 2014; Saunders 1996; Pikrakis, Giannakopoulos, and Theodoridis 2008; A. Pikrakis, Giannakopoulos, and Theodoridis 2006).
We wanted to select an audio feature that would assist the participant in completing their task. However, we also wanted there to be an element of human judgement involved in the task. If we chose an audio feature that was very accurate, the algorithm would be doing all of the work, and the human would only be processing the results. To avoid this situation, we restricted the performance of the audio feature by only allowing a one-dimensional (scalar) feature.
Low energy ratio (LER, also known as ‘silent interval frequency’, ‘energy contour dip’ and ‘low short-term energy ratio’) is the frequency in which the energy of a signal falls below a threshold. This is a simple but effective feature which exploits the fact that speech has frequent silent gaps between words, whereas music does not. Panagiotakis and Tziritas (2005) found that on its own, LER can classify 50% of music segments with 100% precision.
We calculated the low energy ratio by extracting the RMS of the signal (20ms frames, no overlap) and counting the proportion of frames which fell below a threshold (see Equation 4.1.4.1). The threshold can be set as a fixed value (Liang et al. 2005; Panagiotakis and Tziritas 2005), a function of the moving average (Ericsson 2009), or a function of the moving peak value (Saunders 1996). After empirically testing a variety of radio programme recordings, we chose to use a function of the moving average, which we configured as 3% of the mean RMS in a one second sliding window.
\[\begin{aligned} x_{rms}(n) &= \sqrt{\frac{1}{F} \displaystyle\sum\limits_{i=Fn}^{F(n+1)} x_i^2}\\ X &= \{x_{rms}(n) \mid 0 \leq n < \frac{f_s}{F}\}\\ X_{low} &= \{x\ | \ x \in X \wedge x < 0.03 \overline{X} \}\\ \text{LER} &= 100 \times \frac{|X_{low}|}{|X|} \end{aligned}\qquad(4.1.4.1)\]
where \(x_i\) are the audio samples, \(f_s\) is the audio sample rate, and \(F\) is the number of samples in each frame.
We coloured the waveform by mapping the low energy ratio to a linear gradient between two easily distinguished colours. We used blue for representing speech to match the waveform colour of the most commonly used DAW in BBC Radio. To represent music, we inverted the RGB values of the waveform colour to produce pink.
4.1.5 Audio clips
We used radio programme recordings for the audio clips, by choosing a representative selection of programme formats, musical genres and radio stations, shown in Table 4.1.5.1. We sourced the audio content from recordings of BBC Radio broadcasts. We selected ten 5-minute clips that contained only one section of music, with speech before and after, where the music had clear start and end points. We checked the performance of the LER feature to ensure it had only modest performance and was consistent between clips. We cut the clips so that the music was in a different position in each clip. We chose to use nine 5-minute clips so that the segmentation tasks could be completed in around 15 mins, and one clip for training.
| Clip | Network | Programme | Format | Music genre |
|---|---|---|---|---|
| Training | Radio 4 | Desert Island Discs | Interview | Ambient |
| 1 | 1 Xtra | Sian Anderson | Breakfast | Dance |
| 2 | 6 Music | Lauren Laverne | Single | Indie |
| 3 | Radio 2 | Ken Bruce | Phone quiz | Lounge |
| 4 | Radio 3 | Breakfast show | Single | Classical |
| 5 | 5 Live | Sports report | Sports | Band |
| 6 | Radio 1 | Zane Lowe | Interview | Rap |
| 7 | Radio 2 | Jo Whiley | Review | Pop |
| 8 | Radio 4 | Afternoon drama | Drama | Classical |
| 9 | Radio 4 | Front Row | Interview | Alternative |
4.1.6 Metrics
We wanted to measure the user’s performance in completing the speech/music segmentation task when using different audio waveforms. We were interested not only in measuring whether there was an actual difference in the task performance, but also measuring whether the user perceived any difference in their performance. To do this, we used both quantitative and qualitative metrics.
4.1.6.1 Quantitative metrics
Our audio segmentation task involves finding the target audio (in this case, music) and marking the start and end of the desired region. The two primary activities involved in this are seeking through the audio (by clicking on the visualization), and marking the segment (using the buttons or sliders). We chose to use three metrics to quantify the effort, time and accuracy of the completed task.
Effort: We counted the number of seek actions (i.e. clicks on the visualization) used to complete the task.
Time: We calculated how long it took to complete each task. To avoid including “downtime” at the start and end of the task, we calculated the task completion time as the difference between the first user action (e.g. play/seek/mark) and the last marking action.
Accuracy: We calculated the error of the result by using ground truth data about the precise start and end time of the music in the audio, then finding the sum of the absolute error of the selected in-point and out-point.
4.1.6.2 Qualitative metrics
To gather perceptual data about the tasks, we included a questionnaire for the participants to complete after using each visualization. To allow for greater repeatability and comparison with other studies, we chose to use a standardised set of questions. For this, we used the NASA Task Load Index, or TLX questionnaire (Hart and Staveland 1988), listed below. Responses are captured using on a scale between -10 and 10 with the following labels at each end:
Mental demand — How mentally demanding was the task? [very low/very high]
Physical demand — How physically demanding was the task? [very low/very high]
Temporal demand — How hurried or rushed was the pace of the task? [very low/very high]
Performance — How successful were you in accomplishing what you were asked to do? [perfect/failure]
Effort — How hard did you have to work to accomplish your level of performance? [very low/very high]
Frustration — How insecure, discouraged, irritated, stressed, and annoyed were you? [very low/very high]
The full TLX measurement involves converting the sub-scales into an overall TLX rating by weighting them by importance and summing the result (Hart 2006). We wanted to be able to analyse each individual sub-scale, so rather than calculating the overall TLX value, we are reporting the “Raw TLX” values.
Three of the six TLX scales were similar to our three quantitative metrics, as listed below. We used these to compare the actual and perceived differences between the conditions. Additionally, we collected and analysed the results of all TLX scales to report other perceived differences that we could not otherwise measure.
Effort: We used the TLX effort rating to measure perceived effort.
Time: We used the TLX temporal demand rating to measure perceived task completion time.
Accuracy: We used the TLX performance rating to measure perceived accuracy.
4.1.7 Hypotheses
We expected that for all of the metrics, the enhanced waveform would perform better than the normal waveform, and the normal waveform would perform better than no visualization. Specifically, we defined the following hypotheses:
Effort: Audio visualization affects the actual and perceived effort required to segment music from speech, where C1 requires more effort than C2, and C2 requires more effort than C3.
Time: Audio visualization affects the actual and perceived time taken to segment music from speech, where C1 requires more time than C2, and C2 requires more time than C3.
Accuracy: Audio visualization affects the actual and perceived accuracy of segmenting music from speech, where C1 is less accurate than C2, and C2 is less accurate than C3.
4.1.8 Procedure
Before the study began, we asked the participant to read an information sheet and agree to a consent form. There were four stages to the study:
Stage 1: Demographics We asked the participant about their gender, age and the following questions, to gauge their familiarity with DAWs and professional experience:
Do you understand what an audio waveform is? [Yes/No]
Have you previously used any consumer audio editing software? ( e.g. Audacity, GarageBand) [Yes/No]
Have you previously used any professional audio editing software? (e.g. ProTools, Logic, Cubase/Nuendo, SADiE, Startrack) [Yes/No]
How many years (if any) have you worked with audio in a professional capacity? [number]
Stage 2: Training We used a ‘pop-up tour’ to overlay a sequence of text boxes on the interface (see Figure 4.1.3.1). These explained the features and operation of the test interface, then prompted the user to complete and submit a training task using the enhanced waveform (C3). We measured the error of the training task and did not allow the participant to continue until they had completed the task successfully (as defined in Section 4.1.9).
Stage 3: Segmentation task The participant used the test interface to mark the position of music in a speech recording, then submit their result. We logged and timestamped the participant’s actions, including seek, play/pause, zoom and mark. This exercise was repeated three times for each condition, for a total of nine tasks. We wanted to gather feedback directly after each condition to capture the participant’s reaction, and to avoid possible confusion due to switching too often. To achieve this, we grouped the presentation of the conditions (e.g. AAABBBCCC) rather than interleaving them (e.g. ACACBABCB).
Each audio clip can only be used once per participant, otherwise they would be able to remember the location of the the music. To define a balanced sequence for the audio clips, we used a Williams design Latin square (Williams 1949), generated using the crossdes package in R (Sailer 2013). We used Latin squares to block out the effect of the order of presentation, and a Williams design, which is balanced for first-order carryover effects. As the sequence length is an odd number, the Williams design uses two Latin squares to produce an \(18\times9\) matrix.
To generate the order of visualizations, we needed to produce a balanced \(18\times3\) sequence. We did this by taking three columns from our \(18\times9\) Latin square and mapping the values 1–3, 4–6 and 7–9 to 1, 2 and 3, respectively. By calculating the carryover effect of each column of the \(18\times9\) matrix, we found that the middle three columns had the minimum carryover effect, so we used them for our visualization sequence.
After completing the three tasks for each condition, the participant rated the workload of those tasks using the NASA-TLX metrics. We captured the responses using sliders with the labels for each question on either end.
Stage 4: User preference After all the tasks were completed, we asked the participant to select which condition they thought was the easiest, and which was the most frustrating. We used thumbnail images from Figure 4.1.3.2 to remind them of what each condition looked like.
4.1.9 Analysis
As the experiment was unsupervised, we wanted to ensure that all participants completed the tasks correctly. We did this by measuring the error of the task and rejecting participants that submitted a response with an error of 5 seconds or greater. We chose this threshold after running informal tests which showed that under supervision, all responses had an error of up to 5 seconds. We calculated the error as the sum of the absolute error of the in-point and out-point.
We tested for statistically significant differences in the TLX ratings by using SPSS to conduct a repeated measures analysis of variance (rANOVA) (Shalabh 2009, p. 409). We tested the underlying assumptions of normality and sphericity by plotting the distribution for each condition and using Mauchly’s Test of Sphericity (Shalabh 2009, p. 415). Mauchly’s Test indicated that the assumption of sphericity had been violated for the effort metric [\(\chi^2(2) = 9.657, p=.008\)] and temporal demand metric [\(\chi^2(2) = 17.918, p<.001\)]. Therefore, we corrected the degrees of freedom using the conservative Greenhouse-Geisser Correction (Shalabh 2009, p. 416). We then used Tukey’s honest significant difference (HSD) post-hoc test (Shalabh 2009, p. 139) to make pairwise comparisons between the mean values of the metrics.
Our study contained one fixed effect (visualization) and two random effects (audio clip and participant). We could not re-use audio clips for the tasks as participants would remember the position of the music. Therefore, as we did not have results from every participant for every combination of audio clip and visualization, our dataset was incomplete. As we are using a repeated measures design, we would normally analyse the results using a repeated measures ANOVA. However this requires a complete dataset, so we were unable to use this analysis.
We used a linear mixed model to analyse the results of the metrics because it can account for an incomplete dataset and a repeated measures design (Gueorguieva and Krystal 2004). We used SPSS to perform a linear mixed effects analysis (Shalabh 2009, p. 274) of the relationship between visualization and the three performance metrics (seek actions, task completion time and task error). We configured the visualizations as a fixed effect and the audio clips and participants as random effects. We tested the underlying assumptions of homoscedasticity and normality by plotting the residual errors and visually inspecting them, which did not reveal any obvious deviations. We then used the Least Significant Difference (LSD) post-hoc test (Shalabh 2009, p. 137) to make pairwise comparisons between the mean values of the metrics.
4.2 Results
Our study was completed by 63 participants, of which 41 (65%) passed the acceptance criteria of all task errors being under 5 seconds. The failure rate was higher than expected, so we analysed the rejected tasks and participants to look for evidence of any systematic errors that might explain the high number of rejections.

Figure 4.2.1 shows the clips and conditions that made up the rejected responses. Although clips 4 and 5 had a higher number of rejections, these incorrect responses came from all clips and all conditions. There was also no combination of clips and conditions that caused an unusually high number of rejections. We did not find any notable difference in error between the in-points and out-points. Figure 4.2.2 shows the demographics of the participants. We did not find any correlation between rejected participants and DAW experience, professional experience, age or gender.


We were unable to find any systematic errors that would explain the rejected responses, so we suspect that the lack of supervision may have led some participants to perform the task to a lower standard than was required.
Figure 4.2.2 shows that the vast majority of participants had previous experience of using both consumer and professional audio editing software. 61% of participants also had professional experience of working with audio. All participants reported that they understood what an audio waveform was.
4.2.1 Quantitative metrics
We analysed the quantitative performance metrics using a linear mixed model (Shalabh 2009, p. 274). Figure 4.2.1.1 shows the mean values and confidence intervals of the performance metrics and Table 4.2.1.1 lists the statistical significance of the pairwise comparisons between the conditions.


| C1 vs C2 | C2 vs C3 | C1 vs C3 | |
|---|---|---|---|
| Seek actions | \(<.01\) | \(<.01\) | \(<.01\) |
| Task completion time | \(>.05\) | \(<.01\) | \(<.01\) |
| Task error | \(>.05\) | \(<.05\) | \(<.01\) |
4.2.1.1 Seek actions
The audio visualization had a significant effect on the number of seek actions used to complete the task [\(F(3,366)=93.871, p<.001\)]. Based on the mean averages, the enhanced waveform (C3) required 7.5 (30%) fewer seek actions than the normal waveform (C2), and 12.7 (43%) fewer than having no visualization (C1). Additionally, the normal waveform (C2) required 5.2 (17%) fewer seek actions than having no visualization (C1). The differences in seek actions between all three conditions were statistically significant (\(p<.01\)). These results confirm hypothesis H1 (effort).
4.2.1.2 Task completion time
The audio visualization had a significant effect on the time required to complete the task [\(F(3,366)=25.261, p<.001\)]. Based on the mean averages, the task was completed 9 seconds (13%) faster using the enhanced waveform (C3) compared to the normal waveform (C2), and 10.9 seconds (15%) faster compared to having no visualization (C1), both with \(p<.01\). There was no statistically significant difference in task completion time between the normal waveform (C2) and no visualization (C1). The mean time of the normal waveform (C2) was only 1.9 seconds (3%) faster than no visualization (C1). These results confirm hypothesis H2 (time) for C2\(>\)C3, but not for C1\(>\)C2.
4.2.1.3 Task error
The audio visualization had a significant effect on the accuracy of the task result [\(F(3,366)=42.462, p<.001\)]. Based on the mean averages, the error when using the enhanced waveform (C3) was 87ms (14%) lower than when using the normal waveform (C2) with \(p<.05\), and 122ms (19%) lower than when there was no visualization (C1) with \(p<.01\). There was no statistically significant difference in task error between the normal waveform (C2) and no visualization (C1). The error using the normal waveform was only 35ms (5%) less than with no visualization. These results confirm hypothesis H3 (accuracy) for C2\(<\)C3, but not for C1\(<\)C2.
4.2.2 Qualitative metrics


| C1 vs C2 | C2 vs C3 | C1 vs C3 | |
|---|---|---|---|
| Effort | \(<.05\) | \(<.01\) | \(<.01\) |
| Frustration | \(<.05\) | \(<.05\) | \(<.01\) |
| Mental demand | \(>.05\) | \(<.01\) | \(<.01\) |
| Performance | \(>.05\) | \(<.05\) | \(<.01\) |
| Physical demand | \(>.05\) | \(<.01\) | \(<.01\) |
| Temporal demand | \(>.05\) | \(<.05\) | \(>.05\) |
We analysed the TLX ratings using repeated measures ANOVA (Shalabh 2009, p. 409), which found that the audio visualization had a significant effect on the TLX ratings from participants [\(F(12,152)=3.552, p<.001\)]. Figure 4.2.2.1 shows the mean values and confidence intervals of the TLX metrics. Table 4.2.2.1 lists the statistical significance of the pairwise comparisons between the conditions.
The TLX ratings from participants show that compared to both the normal waveform (C2) and no visualization (C1), the enhanced waveform (C3) was perceived to be less mentally and physically demanding, better performing, less frustrating and requiring less effort (all \(p<.05\)). The participants also rated the enhanced waveform as less temporally demanding than the normal waveform (\(p<.05\)). Compared to no visualization (C1), participants rated the normal waveform (C2) as being less frustrating and requiring less effort (both \(p<.05\)).
The effort ratings confirm hypothesis H1 (effort); the temporal demand ratings confirm hypothesis H2 (time) for C2\(>\)C3; and the performance ratings confirm hypothesis H3 (accuracy) for C2\(<\)C3.
The participants rated the enhanced waveform (C3) as significantly less physically demanding than the normal waveform (C2). This was surprising, as all of the tasks were conducted using a screen and mouse, so did not require much physical exertion. We do not know how participants interpreted this metric, but it’s possible that some may have classified the movement of the mouse or number of mouse clicks as physical activity.
Participants were asked to select which audio visualization was the easiest to use, and which was the most frustrating. The results are shown in Figure 4.2.2.2. The enhanced waveform (C3) was rated as the easiest to use by three quarters of the participants. Having no visualization (C1) was rated as the most frustrating condition by two thirds of the participants. The normal waveform (C2) was not considered by many to be the easiest, nor the most frustrating.


4.3 Discussion
Our study found that by using an enhanced waveform visualization, participants could segment music from speech faster, more accurately and with less effort than by using a normal waveform. When using the normal waveform, participants could segment music from speech with less effort than having no visualization, but we did not find any significant differences in the time it took, nor the accuracy of the result. Table 4.3.1 summarises the findings for the hypotheses we tested.
| Quantitative metrics | Qualitative metrics | |||
|---|---|---|---|---|
| H1 (effort) | C1\(>\)C2 | C2\(>\)C3 | C1\(>\)C2 | C2\(>\)C3 |
| H2 (time) | – | C2\(>\)C3 | – | C2\(>\)C3 |
| H3 (accuracy) | – | C2\(<\)C3 | – | C2\(<\)C3 |
The mean number of seek actions for the enhanced waveform was 30% less than for the normal waveform, and the mean task completion time was 13% faster. This shows that the participants did not have to navigate the audio as often to complete the task. This is likely to be because the colour enhancement allowed participants to narrow their search region, so they did not have to perform as much listening as they otherwise would. The enhanced waveform resulted in 14% higher accuracy than the normal waveform, potentially because the colour helped to narrow the search region used to find the precise start and end time of the music.
The increased performance of the enhanced waveform demonstrates that there is potential in the colour mapping techniques explored by Tzanetakis and Cook (2000), Rice (2005) and Mason, Evans, and Sheikh (2007). We did not attempt to select the best possible semantic audio feature, nor the optimum colour mapping technique, as we wanted there to be a level of human judgement involved in the task. It is likely that optimising these would provide much better performance than the visualization we tested.
Radio programmes must be produced in a limited time period, which means that radio producers often work to tight deadlines. A reduction in the time and effort needed to perform simple editing tasks could give radio producers greater freedom to focus on more creative activities. In turn, this could potentially lead to improvements in the editorial quality of programmes.
Although normal waveforms allowed participants to complete our music segmentation task with less effort than no visualization, there was no significant difference in the task completion time, nor the accuracy of the result. In a study made up of 41 participants, we would have expected to find a significant difference compared to the baseline. This poor performance raises questions over how helpful waveforms are as a navigational aid.
The consequence of poor performance of waveforms is particularly high because waveforms are the default visualization for most digital audio workstations. With our enhanced waveform, we have seen that it is possible to provide greater efficiency for navigating and editing audio for at least one task. Improving the performance of the default visualizations in DAWs could make a marked difference to a large number of people, as audio editing software is used around the world by various professionals, many of whom spend much of their working life interacting with audio using these visualizations.
We selected low energy ratio (LER) as a semantic audio feature for discriminating between music and speech. Low energy ratio is based on detecting changes in the amplitude profile. Although these changes can clearly be seen using an audio waveform, they are only visible when the waveform is sufficiently zoomed-in. It is therefore important not only to include the right information, but to present it in a way that humans can read.
We restricted our selection of the semantic audio feature to a one-dimensional value, and used pseudocolour to map the value to the waveform. Low energy ratio is just one of many features we could have used for this task. There are other features that are more effective and could further improve user performance. Multiple features could also be combined by using weighting, by using logic to switch between them or by mapping them using false colour.
The ability to visually identify the location of music has applications beyond removal of unwanted music. Mason, Evans, and Sheikh (2007) mapped three semantic audio features using false colour to display the structure of radio programmes to help consumers navigate audio recordings. Many daytime radio programmes alternate between speech and music, so being able to see where the music is played would provide a visual structure of the programme. This could help producers and the audience navigate to the next piece of speech or music, and get a sense of the programme format and length.
4.4 Conclusion
We conducted an online user study in which 41 participants segmented music from speech using three within-subjects conditions — a normal audio waveform, a waveform enhanced by mapping semantic information to colour, and without using any visualization. Based on both quantitative and qualitative metrics, we found that using the enhanced waveform, participants completed the task faster, more accurately and with less effort than the normal waveform. Using the normal waveform required less effort than no visualization, but was not significantly faster, nor more accurate.
Our results show that mapping semantic audio features to a visual representation can improve user performance. Given the large-scale use of waveforms in audio production, making improvements to the audio visualization could make a meaningful impact on a large community. For this study, we selected a rudimentary audio feature and visual mapping. There are opportunities to develop more efficient audio visualizations by combining multiple features and using more advanced visualization techniques, targeting either specific applications or general use.
5 Screen-based semantic speech editing
In Chapter 3, the radio producers we observed all used textual representations to navigate and edit audio content. The drama producers used a script to write notes on what they recorded, any changes or mistakes that were made, and the quality of the performances. The documentary producers wrote transcripts of their recordings to help them navigate and arrange their content, and to mark up the parts they wanted to use in the programme. The news journalists also used text to label their audio clips with the words spoken at the start and end of the clip.
In Section 2.4 we saw that transcripts have been successfully used to develop interfaces that allow for semantic navigation and editing of speech content. Whittaker et al. (2002) found that their semantic speech interface could be used to quickly extract information and judge which parts were relevant, without having to play the audio. Whittaker and Amento (2004) found that semantic editing was faster and as accurate as editing with a waveform-based interface, and Sivaraman, Yoon, and Mitros (2016) found that semantic editing was more accessible than waveform editing. Rubin et al. (2013) presented a semantic speech interface for producing “audio stories”, which has many similarities to radio production. However, this system was not formally tested, so it is still unclear what effect semantic editing interfaces have on the production of audio content.
We saw in Chapter 3 that the documentary producers we observed either manually transcribed their recordings, which may not be the best use of their time, or paid a third-party to transcribe on their behalf, which is slow and expensive. As we discussed in Section 2.2.2.3, automatic speech recognition (ASR) could be used to replace the manual transcription process. However, the errors in ASR transcripts reduce listener comprehension (Stark, Whittaker, and Hirschberg 2000; Vemuri et al. 2004) and increase the time it takes to search audio content (Ranjan, Balakrishnan, and Chignell 2006) and correct errors (Burke, Amento, and Isenhour 2006). The semantic speech editor from Rubin et al. (2013) used verbatim transcripts, so it is not clear how these errors might affect audio production. Several semantic speech editors that used ASR were formally evaluated (Whittaker and Amento 2004; Yoon et al. 2014; Sivaraman, Yoon, and Mitros 2016), but they were designed for navigating and editing voice messages and comments, which use a different style of audio content and have different requirements than radio production.
We were interested in investigating whether semantic speech editing can be used for radio production, and understanding what effect semantic editing and ASR transcripts have on the production process. In this chapter, we describe the design and development of Dialogger – a semantic speech editing interface for radio production, and explain how we evaluated our system with radio producers at the BBC.
In Section 5.1, we review the existing production process to gather requirements for the design of our system. In Section 5.2, we describe the design and development of Dialogger. In Section 5.3, we outline the methodology of our contextual user study in which radio producers used Dialogger as part of the production of real radio programmes. We present the results of our study in Section 5.4, discuss our findings and their implications in Section 5.5 and present our conclusions in Section 5.6.
5.1 System requirements
In this section, we will review the results of our study in Chapter 3 and map our observations into system requirements for our semantic editing system.
We saw that the producers of the documentary “logged” each interview they recorded by transcribing it themselves, or by paying a third-party service to write a full transcription. They then used the transcripts to select which bits they wanted to use, and copied the text to create a rough script of the programme. Once the script was mostly complete, they had to find and cut each piece of audio for the programme, then assemble them into a draft composition known as a “rough edit”.
Both the transcription and rough edit processes are time-consuming for the producer. Semantic speech editing may be able to make these two production activities more efficient. We will consider these individually to gather high-level requirements for our system.
5.1.1 Transcription
As we discovered in Chapter 3, radio programmes are assigned a slot in the broadcast schedule, so producers have a strict deadline for finishing their programme. Programmes are sometimes scheduled up to three weeks in advance, but sometimes as little as one week in advance. This means that producers have very little time to spare. If a programme’s budget allows, interview recordings can be sent to a transcription service where they are transcribed by a person overnight. However, many programmes do not have the budget for this, in which case the producer transcribes the recordings themselves.
Transcripts are used to help the producer make editorial decisions, but are usually not published. For this reason, the transcripts only have to be sufficiently accurate to use for editing. Both Whittaker and Amento (2004) and Sivaraman, Yoon, and Mitros (2016) found that the errors in the transcripts did not prevent users from being able to edit using them. However, both also found that users wanted to be able to fix incorrect words in the transcript.
Requirement: Our semantic editing system needs to be able to produce a transcript quickly and cheaply. It should be accurate enough to be useful for editing, and allow for correction where necessary.
5.1.2 Editing
There are already well-established systems and software packages in place for producing radio programmes. As we discussed in Section 2.1.1, producers use a digital audio workstation (DAW) to select the parts of each interview that they want to use in their programme, and to arrange them into a narrative. In Chapter 3, we learned that the BBC provides two different DAWs – dira! StarTrack (made by SCISYS) and SADiE (made by Prism Sound). Both of these use waveforms to visually represent audio to help the user navigate the recordings. The edits performed in a DAW are “non-destructive” because the original recordings remain untouched (see Section 2.1.1). This allows the producer the flexibility to adjust or undo their decisions at any point during the editing process.
For the documentary production we observed in Chapter 3, a specialist sound engineer, known in the BBC as a studio manager (SM), was brought in on the last day of production to ensure that the sound was well balanced, and to do any advanced editing that was required. This included removal of unwanted “umm”s or breaths in a process called “de-umming”. The SM for the observed documentary suggested that being able to de-umm speech in a way that is inaudible to the listener is a skilled task that requires precision, judgement and experience.
Music is often included in a programme, either as a theme tune, a short interlude or in the background. We observed that producers select the music either from their personal collection, or from one of a number of services for finding commercial or rights-free music, such as Audio Networkhttps://www.audionetwork.com/ (accessed 15.08.2016)
. The music is added and edited using the DAW.
At the end of the editing process, the editor listens to the programme with the producer to give their feedback and sign-off. As part of this process, they both listen out for repeated words or phrases. However, this is only usually a problem in drama production where multiple takes of the same lines are recorded.
Requirement: Our semantic editing system needs to be able to select and arrange parts of audio recordings. Given that there are well-established radio production systems for advanced editing tasks such as de-umming and addition of music, it also needs to be able to integrate with these so that it can be used in professional radio production.
5.2 System design
This section describes the design of our system, as guided by the requirements set out in Section 5.1. We explain our choice of transcription, editing interface and excluded features before describing the functionality and operation of Dialogger.
5.2.1 Transcript
We considered three factors when choosing a transcription method – turnaround time, cost and accuracy. Manual transcriptions are nearly 100% accurate, however they are expensive (about $1 per minute) and slow (typically 24 hours). Automatic transcriptions are imperfect, but cheap (about $1 per hour) and fast (quicker than real-time listening). Our system requires quick and cheap transcripts that are sufficiently accurate, so we chose to use automatic transcripts generated by a state-of-the-art commercial web servicehttps://www.speechmatics.com/ (accessed 15.08.2016)
. Whittaker and Amento (2004) and Sivaraman, Yoon, and Mitros (2016) found that users want to be able to correct the transcript, so we designed our system so that users can fix incorrect words. Rubin et al. (2013) did not include this feature as they used verbatim transcripts.
5.2.1.1 Speaker diarization
As part of the transcription process, the ASR system performed speaker diarization (see Section 2.2.2.2), gave each speaker an identification number and estimated their gender. We segmented the transcript into paragraphs to indicate changes in speaker, and used a text label at the beginning of each paragraph to display the gender and identification number (e.g. [M2], [F5]). Rubin et al. (2013) also identified speakers by placing their respective parts of the transcript in different columns. However, this approach limits the number of speakers by the number of columns that can be displayed. By labelling paragraphs, we are able to support multiple speakers.
5.2.1.2 Confidence shading
The ASR system provided us with a rating for each transcribed word that indicated the system’s confidence in the accuracy of that word. As we discussed in Section 2.4.7, confidence shading is a technique used to shade words that fall below a confidence threshold. Suhm, Myers, and Waibel (2001) found that confidence shading slowed down correction, but Vemuri et al. (2004) found that it improved comprehension. However, neither of these results were statistically significant. Burke, Amento, and Isenhour (2006) did not test the performance of confidence shading, but the study participants reported that confidence shading was helpful for identifying mistakes in the SCANMail interface. On balance, we chose to include confidence shading because the findings from Vemuri et al. (2004) and Burke, Amento, and Isenhour (2006) are based on more modern ASR systems.
5.2.2 Interface
Our semantic editing system needs to be able to select and arrange parts of audio recordings. To achieve this, we used the same drag-and-drop interface as Hyperaudio Inc. (2016) as it is a simple method for extracting and re-ordering clips. As shown in Figure 2.4.4.1, it also allows clips from different recordings to be added and re-arranged. Casares et al. (2002), Sivaraman, Yoon, and Mitros (2016) and Berthouzoz, Li, and Agrawala (2012) used a select/delete interface, where parts of an individual transcript could be chosen or removed, and Whittaker and Amento (2004) and Rubin et al. (2013) used a cut/paste/delete interface.
We designed our interface to be browser-based, as the BBC corporate policy meant that it was not possible to install new software on the producers’ computers. This came with the added benefit of allowing users to work from anywhere in the world on any operating system, but the downside is that they have to be connected to the Internet.
5.2.3 DAW integration
Our system needs to be able to integrate with the existing radio production tools. We designed Dialogger to be used as the first stage of the editing process, and to smoothly integrate with the DAWs that are used in BBC Radio. We achieved this by providing a novel feature to export edited content from our system, either as a WAVE audio file or as an edit decision list (EDL).
The first option exported a single WAVE audio file of the edit. This method is a destructive edit, in that it throws away the pieces of the recording which weren’t selected. The other option exported an EDL, which contains metadata about which parts of an audio or video recording make up an edit. These can be read by the two most common audio editors used at the BBC – SADiE and dira! StarTrack. This method is considered non-destructive as the full original recordings are retained and the edit points can be re-adjusted in the audio editor.
5.2.4 Excluded features
Rubin et al. (2013) included features for finding music tracks and creating loops within them. In Chapter 3, we found that specialist tools are already used for finding and choosing music, and that editing of music is already efficiently handled by the DAW. Therefore, we chose not to include features for adding or editing music.
Rubin et al. (2013) also included detection of repeated words and phrases. We chose not to include this, as we found in Chapter 3 that repeats are only an issue in drama production. As the production of drama involves a very different workflow of recording multiple takes of lines from a script, we chose to focus on production workflows for pre-recorded content in our system design or study.
5.2.5 System description
This section gives a brief overview of Dialogger, including its functionality and operation. A screenshot of the interface, and numbered list of its main features, are shown in Figure 5.2.5.1.

5.2.5.1 Transcript
The ASR system we chose was evaluated using a large multi-genre television dataset (Bell et al. 2015). It had an overall word error rate of 47%, however for news content, which is clearly spoken by a native speaker, this dropped to 16%. As the speech on radio programmes is similar in nature to speech on television news, we found the error rate to be comparable. However, recordings with non-native speakers or significant background noise had a higher error rate. For comparison, the reported error rate of the system used by Whittaker and Amento (2004) was 28%, and for Sivaraman, Yoon, and Mitros (2016) it was 10%.
The time taken by the transcription service to process each uploaded recording was approximately half as long as the length of the recording. The time depends primarily on the length of the recording but also on noise, accents and the complexity of the speech.
5.2.5.2 Operation
The functionality and operation of the system is described below as a typical user journey. Each feature is numbered and shown in Figure 5.2.5.1.
Users access Dialogger by navigating to a web page in their browser. They start by logging into the system using their account (1) and create a project where they can upload their speech recordings (2) that appear in a list on the left (3). Each recording is automatically transcribed. When it is opened, the waveform appears at the top and the transcript appears in the middle section. The recording can be played (5) and navigated by using the waveform (4) or by clicking on a word in the transcript (6). The transcript shows where different people are speaking using paragraphs labelled with the speaker’s gender and an identification number (e.g. [F2]). Words which are likely to be incorrect are shaded grey (7), known as “confidence shading”. Incorrect words can be fixed by double-clicking them and typing the correct word. The transcript text can be copied or printed using buttons at the top. The audio can be edited by selecting a range of words (8), then using drag-and-drop to place it in the area to the right which creates a clip (9). Clips can be re-ordered and deleted. The total duration of the edited clips is displayed (10). The edited audio can be played through to preview the result, and the edit can be saved. Finally, the edited clips can be exported as a WAVE audio file or as an EDL (11) for further editing in a DAW.
5.3 Evaluation methodology
We wanted to determine whether professional radio producers could successfully employ the features of Dialogger as part of the production of a real radio programme. Specifically, we were interested in measuring whether semantic speech editing was faster than their existing technique, and if it continued to be used after the trial. We also wanted to investigate how the semantic editor was used and whether there were any features that could be added to improve the functionality.
Additionally, we wanted to take this opportunity to continue our research on the existing radio production workflow to learn more about the challenges producers face and the tools they use to produce their programmes. Our study in Chapter 3 did not explore requirements in-depth, and there is not much previous literature that analyses actual radio production practice, so we wanted to be able to inform researchers and designers about real requirements and behaviour in this field.
To achieve these goals, we conducted a qualitative contextual study of radio producers working under two conditions – the existing editing workflow and the semantic editing workflow.
5.3.1 Approach
Gaining access to radio producers can be difficult as there are not many of them and they are normally very busy. For example, Kim, Oard, and Soergel (2003) attempted to recruit radio producers but was unsuccessful because the producers were “so highly tasked”. However, in this case we were able to recruit professional radio producers from the BBC Radio due to the access available to us from working within the BBC.
As we would not be able to recruit a large number of participants, we chose to take a qualitative approach to maximise the depth of the information gathering. To take advantage of the available access to the work environment, we chose to use contextual inquiry techniques to allow us to learn about the workflows, tools, and the social, technical and physical environments. This took the form of an initial interview, followed by a period of observation, then a final interview.
Radio producers find it difficult to step away from their day-to-day work for too long. To account for this, we designed our study so that the tasks overlapped with the production of the programme that the participant was working on at the time, and the audio content they needed to edit that day. We interviewed and observed participants in their normal working environment to ensure that the production workflow was not affected by an artificial setting.
5.3.2 Recruitment
We invited professional radio producers with at least five years of experience to take part by sending an email to departments in BBC Radio that create pre-produced factual programmes. Drama programmes were excluded from the study as we saw in Chapter 3 that their production workflow involves making multiple recordings of lines in a script and selecting the best ones. This is a sufficiently different process to other programme genres that it warrants a different interface.
Five participants (P1–P5) were recruited (4 male, 1 female) who each had between 6 and 20 years experience working as a radio producer. Although we had a small number of participants, the experience of the producers and the depth of the study means that their feedback should carry significant weight. Five participants is also considered sufficient for identifying most usability problems (Nielsen and Landauer 1993).
During the experiment, the participants worked on programmes of different lengths from a range of genres: P1 produced a single 27-min documentary, P2 produced a 27-min documentary as part of a ten-part series, P3 produced a single 45-min documentary, P4 produced a 14-min archive programme (based around material from the archive) as part of a ten-part series, and P5 produced a single 27-min magazine show (covering multiple stories on a single theme).
5.3.3 Procedure
We designed a five-stage experimental procedure that followed a typical contextual inquiry format of interview/observation/interview. In addition, we recorded some simple metrics such as task completion time and feature usage.
Stage 1: Background interview The participant was first given an overview of the project and the study, and asked to complete a consent form. This was immediately followed by a semi-structured interview to learn about the participant’s background, their existing production workflow and the tools they used. The investigator asked the participant to describe the radio production process in detail, and used follow-up questions to clarify their understanding. This information was recorded using written notes.
Stage 2: Dialogger training Each participant was trained on the functionality of the Dialogger interface using a pre-written “tool-tip tour”, in which the participant was presented with a sequence of instructional pop-up dialog boxes overlaid on the interface. This ensured consistency of training between participants. Each participant was then issued with a series of tasks that utilised all of the system functionality. The investigator observed this stage and wrote notes of any unexpected behaviour or stumbling blocks.
Stage 3: Task observation Each programme is composed of a number of interviews on a single topic, or set of topics. We observed the participant while they logged and rough-edited two different interviews for the same programme. They did this by editing an interview under each condition – one using their existing production workflow, and the other using Dialogger. The order of the conditions was counterbalanced.
The investigator sat beside the participant during the task and wrote notes on the workflow, tools, generated metadata, usability issues, task completion time, and unexpected reactions or usage. The actions of the participant on Dialogger were logged electronically. After they completed the task, they were asked to rate each condition using the NASA Task Load Index metrics (Hart and Staveland 1988).
Stage 4: Interview We conducted a semi-structured interview about the participant’s experience of each system and how they compared. The investigator questioned participants about the advantages and disadvantages of each workflow, then asked about any specific topics, issues or questions that arose during observation. The audio from this interview was recorded and transcribed to allow for further detailed analysis.
Stage 5: Longitudinal deployment Each participant was then given access to Dialogger for a further month, and was invited to continue to use it if they wished. Each week, they were asked via email whether they had been using the system, and if so, which features they valued most/least or were missing. During this time, their usage of Dialogger was also logged electronically.
5.3.4 Analysis
Our study produced observation notes, interview transcripts and metrics. We used thematic analysis with open, flat coding to interpret the textual data, and we used statistical analysis to process the numerical data, as described below.
5.3.4.1 Coding
We manually transcribed the audio recorded from the interviews in Stage 4 to produce a verbatim transcript, and collated them with notes made by the investigator from stages 1, 2 and 3. To organise and process this textual information, we employed the use of thematic analysis (Braun and Clarke 2006).
We performed a two-stage coding process. Firstly, we openly coded each part of the transcripts into a flat structure. As there are not many previous studies on radio production, we decided to use open coding so that the categories would emerge from the data we collected, rather than attempting to test an existing model. We used the software package RQDA (Huang 2016) to execute this stage.
Once all of the text had been processed, we grouped the codes that had common themes. We used mind-mapping software to help us re-arrange the codes into various hierarchical structures until a logical solution was found. The coding and grouping was performed by the investigator that collected the data.
5.3.4.2 Metrics
Although this was primarily a qualitative study, we chose to collect some basic metrics to measure task completion time, cognitive load and usage after the trial.
We used task completion time from Stage 3 as a metric for editing speed. As participants used different interviews of varying lengths for each condition, we measured task completion time relative to the length of the audio recording being edited. We used a paired t-test (Shalabh 2009, p. 17) to test for any significant difference between the existing and semantic editing workflows.
To measure the cognitive load of each task, we used the raw TLX metrics gathered from the questionnaire in Stage 3. We used a paired t-test on each of the six metrics to test them individually for any significant differences.
Finally, to measure the level of usage during the longitudinal deployment in Stage 5, we collected the time spent using the interface, the number of new uploads and the number of exported edits. As this data is only relevant to the semantic editing workflow, we will report the raw numbers.
5.4 Results
The coding process resulted in 40 codes, which were grouped into ten categories and four themes (see Table 5.4.1). The codes contain comments about both the existing and semantic editing workflows, however for clarity we will present these results individually.
We start by going through the existing radio production workflow in detail, with an emphasis on the challenges that were identified, and the tools that are used as part of the process. We then consider the semantic editing workflow and expand on the four themes identified during coding. Finally, we look at the results of the metrics that we captured during the observation and longitudinal deployment.
| Theme | Category | Codes |
|---|---|---|
| Comprehension | Challenges | Complexity, quantity, environment, concentration, time taken |
| Navigation | Speed, search, paragraphs, speaker segmentation, time since recording, cross-referencing |
|
| Accuracy | Correction, accents, good enough, confidence shading, use after editing | |
| Organisation | Mark-up | Bold, star rating, labelling, annotation, timestamps, word processing |
| Programme script | Structuring, collaborating with presenter | |
| Editing | Sound quality | Fast playback, anxiety of not listening |
| Technique | Deleting, workflow, transcript not needed for short edits, similarity to TV | |
| Usability | Portability | Laptop, paper |
| Drag’n’drop | Space on clipboard, scrolling | |
| Misc | DAW integration, transcript turnaround time, simultaneous uploads, video support, waveform, avoidance of repetition |
5.4.1 Existing workflow
In this section, we consider the comments made by participants about their existing workflow. We have organised these by the categories from the thematic coding (see Table 5.4.1).
5.4.1.1 Challenges of comprehension
The skill of the producer is to “separate the wheat from the chaff” (P1, P3, P4 – all verbatim) and to find the clips which will make an interesting programme.
“That’s the basis of my job - to find great stuff and put it together. It’s not difficult putting it together, it’s finding the great stuff and finding connections between it. Getting rid of the non-great stuff is challenging and time-consuming, and it requires mental processing.” (P1)
However, the sheer quantity of recordings means this process adds significant overhead.
“you’ve got an average of 45 mins per interview and in a series of three programmes you’ve got seven per programme, that’s a lot of work” (P3)
Interviews recorded for speech radio often cover complex topics in fine detail. Keeping track of all the points raised and forming a compelling narrative from them is a challenge.
“All the interviews overlap with each other terribly, and have got similar themes.” (P4)
Writing the logs takes a lot of concentration as the producer must listen to what is being said, work out how it ties in with other contributions and the story, and make swift judgements on whether it should be used.
“one of the slightly exhausting things about doing it is the level of concentration you have to maintain to make good decisions, remember where everything is, what you’ve got, is kind of strained rather by having to just do schleppy tasks like moving the sound and logging interviews” (P3)
P1 and P5 reported that they find the office environment distracting, so often work at home or outside the office.
“I typically do this at home because I find it a much less distracting environment. It does require quite intensive concentration so you don’t miss something.” (P1)
“In the office there’s so much pressure and you’re always doing stuff.” (P5)
Although P4 did not do any logging during observation, they explained that for longer recordings, they would normally write logs by hand in a notebook whilst listening on a portable music player somewhere away from the desk, such as in a café.
The high level of concentration required, combined with the repetition of typing and listening to the interview again means that producers need to take regular breaks.
“it’s boring and it’s not very easy to be efficient at it [...] when I’m normally doing it I’m checking my emails, making a cup of tea.” (P3)
5.4.1.2 Programme script
The producers organised the programme by writing a script. This is primarily used to help them structure their thoughts, but also to help communicate with the presenter over email.
In the study, P1, P2 and P5 started their scripts during the research stage by writing an ordered list of bullet points of topics to cover and a list of draft questions to ask contributors. P3 and P4 waited until after they had done some interviews to start the script, as they wanted to structure the programme around the discussions that they recorded.
P3 and P5 updated the script after every edit to ensure they were always in sync. This added significant overhead but gave them a visual structure to follow when making the final changes. Having an accurate script also makes it easier to re-use the programme afterwards, when creating another version of a different length, or for pulling out clips for the website.
“[The script] is going to be invaluable when it comes to re-cutting this.” (P5)
5.4.1.3 Mark-up
P1, P3 and P5 would make comments for themselves in the log to help them when editing. For example, “[good to here, dull after]” or “[trails off 9’30]”. P1 also used a star rating system to rate the quality of each point, for example “[**** should use this stuff, but dramatically cut down]”.
“What I sometimes do when I edit is star good bits, and I think that’s quite a common trait.” (P3)
Bold highlighting was also used by P1 and P3 to mark bits of the transcript which are important and worth keeping.
“what I did was just put in bold the paragraphs I thought were worth [keeping]” (P1)
P2 used a different approach to logging their material. Instead of logging the material by writing a transcript, they played the recording in a DAW and used a keyboard shortcut to create timed markers at any points of interest. By seeing where the markers clustered, they identified where to make clips, then gave each of the clips labels. This approach allowed them to focus more on the audio, but didn’t allow them to make any detailed notes.
5.4.1.4 Sound quality
Radio is an audio-only medium, so the quality of the content is highly dependent on the quality of the sound. The criteria producers use for deciding whether a piece of audio is good enough to use in their programme is not just about what was said, but how it was said and how well it was said.
“How people say things is very important.” (P5)
On the one hand, producers need to listen out for any poor quality sound that might negatively affect the programme, such as people mumbling, stumbling, coughing, or any excessive background noise.
“I’ve done paper edits before where I’ve gone back to that bit of audio and they didn’t quite finish the sentence or they muttered it. You just couldn’t use it at that point.” (P3)
However, the producers were also listening out for anything that worked particularly well, such as a moment of comedy or passion, or a sound that perfectly captures the right feeling. Identifying these using the text of a transcript is very difficult or impossible.
Every participant that performed logging played the audio faster than real time at least once. This allowed them to efficiently listen out for anything they might want to use while reviewing parts of the interview that may not be of interest (e.g. off-topic or “off-mic” discussions). P2 also used faster playback to prevent themselves from over-thinking their edit decisions and picking out too much material.
“The ability to listen at faster than real-time [...] gives me the opportunity to come to a swifter decision.” (P2)
5.4.1.5 Edit technique
If the recording was short and had been recorded recently, as was the case for P4 and P5, it can be edited without first creating a log.
“If it’s a quick ten minutes with three questions, you don’t need to bother” (P3, also P4 and P5)
In this situation, we observed that the producers listened through the recording using a DAW and pressed a keyboard shortcut to split the recording, usually at the beginning/end of questions/answers. They then went back to remove unwanted segments and add labels to the remaining ones.
In the cases where the recording was logged (P1, P2, P3), the producers used the log to decide which parts to select or remove. They used the timestamps written in the log to narrow down their search area for each clip they extracted. However, even with a reduced search area, the producers found it time-consuming to find the exact start and end point of each clip using the DAW interface.
In the study, three of the participants (P3, P4 and P5) used SADiE as their DAW, which is provided to the producers by the BBC. However, the other two participants chose to use other software packages that aren’t formally supported. P1 used Adobe Audition because they were familiar with the interface and it was installed on their laptop, unlike SADiE which was only available to them on a desktop computer.
P2 comes from a television production background and used Apple’s Final Cut Pro, which is primarily a video editor but also includes audio editing functionality. P2 used Final Cut Pro because they were familiar with the interface and had it on their laptop. In addition, they enjoyed being able to import audio directly from video content without having to use another program to extract the audio first, and being able to use the video “titles” feature to make written notes that can later be viewed in time with the audio.
5.4.2 Semantic editing workflow
This section discusses the results and themes that emerged from the evaluation of the semantic editing interface. Participants were first introduced to Dialogger through a training stage (Stage 2). All of the participants completed the training without any major issues. However, this stage highlighted a requirement for keyboard shortcuts which was not previously identified. P2 and P3 kept trying to use the space bar to start and pause audio playback. This is a common shortcut in most DAWs which these participants naturally reached for. Reports on previous semantic editing systems have not mentioned keyboard shortcuts, however they could be used to assist the editing process.
In the rest of this section, we will discuss each of the themes that came out of the thematic coding (see Table 5.4.1).
5.4.2.2 Transcript accuracy
When using the semantic editing interface, editing decisions are based on an automated transcript which is only partially accurate. Previous research has shown that for editing voicemail recordings (Whittaker and Amento 2004), discussions (Sivaraman, Yoon, and Mitros 2016) and spoken comments (Yoon et al. 2014), automated transcripts were considered sufficiently accurate. However, the ASR transcript accuracy required for navigation and editing in radio production is currently unknown.
The participants in our study suggested that the transcripts were, generally speaking, sufficiently accurate for their purposes.
“It’s clearly not 100% in word recognition but I’m feeling it’s certainly good enough for my rough cut purposes at this point” (P2)
If the recording being edited was made recently, the producer can use their memory of what was said to make sense of the inaccuracies in the transcript.
“Both these interviews [being edited] are relatively recent so I have it reasonably in my mind what they’ve been saying. I was able to read roughly what there was - ‘okay that’s that question’, ‘I know what was in that question’” (P1)
In the existing radio production process, transcripts are used to aid the producer and presenter, but are not shared outside of the production team. In our study, the producers we observed only used the transcript to navigate and edit the audio. However, P3 and P4 noted that they were interested in correcting the transcript later so it could be shared or published.
“I’m probably posting transcripts for the whole interview. So I do need to go through and correct” (P4)
Being able to provide corrected transcripts has the potential to make an impact beyond improving the editing workflow. For example, transcripts of the finished programme could make the audio content searchable and re-usable for print media.
5.4.2.3 Mark-up
During the study, P1 and P3 copied the transcript text from the interface into Microsoft Word. They reported that they did this because there was no annotation functionality available within Dialogger.
They inserted paragraph breaks, added notes after paragraphs, and highlighted desired parts of the transcript in bold. Once the transcript was annotated in Microsoft Word, they went back to Dialogger, found the parts of the transcript they wanted by scrolling though the text, then dragged and exported each clip individually as a WAVE file.
“it would be better to take raw lumps of transcripts and plonking them in Word because Word has higher functionality than this” (P3)
Producers are very familiar with the Microsoft Word interface so a later version of our system could seek to provide a similar interface. This would allow producers to make annotations in the same way they do already.
“With text editing, the reflexes are very much Microsoft Word” (P4)
The most basic feature that could be added is highlighting, which is often used to note parts of interest
“If you just put a little star or underline or something simple to mark things, that would be a big gain for a small change” (P3)
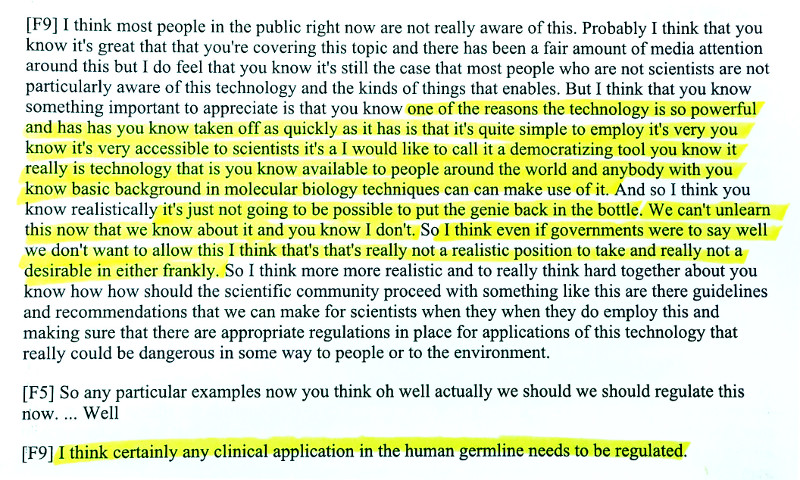
5.4.2.4 Portability
P5 reported that working on paper allowed them to be productive outside of the office, such as during their commute.
“What would be really useful would be to [...] take it away (say when I’m on the train going home) and I would paper edit the bits that I need” (P5)
Additionally, working on paper allows them to work anywhere as it does not require electricity.
“It’s highly portable. It doesn’t require any power.” (P2)
In the observed task, after uploading their recording, P2 immediately printed the transcript and read through it on paper so that they could work away from the screen.
“I’m reading a lot of material for a sustained period so I’d prefer to do it on page than on screen. Just easier on my eyes.” (P2)
P2 then used a highlighter pen to select the desired parts of the recordings (see Figure 5.4.2.3.1). After highlighting all the pieces they wanted, they then used the Ctrl+F text search to find the highlighted words in Dialogger.
“it allowed me to get to clips very quickly from a reference point on a printed transcript” (P2)
However, P2 noted that having timestamps on the printout may be a faster way of achieving the same thing. Once they had found and clipped all of the highlighted parts in Dialogger, they exported the clips into SADiE.
P4 explained that for an upcoming programme, they were planning to print out transcripts from Dialogger to help them collaborate with their presenter.
“we’re just going to go through it with a pencil and paper, with a printout, and highlight the bits we want and cross out the bits we don’t.” (P4)
5.4.2.5 Sound quality
Part of the appeal of having a transcript is that it frees the user from listening to the audio in real-time. It also allows users to work on paper, away from any electronic devices. However, disconnecting the audio from the text fundamentally changes the production process.
“Radio is made with your ears. You’ll never get away from that fact that you need to listen” (P4, also P2, P3, P5)
There was also concern that parts which sounded great but didn’t come across as well in the transcript may have been overlooked.
“I was anxious it might not have sounded as good as it read, or that I might be missing bits that sounded great” (P2)
As discussed in Section 5.4.1.4, the existing workflow of the participants includes playing the audio faster than real time, but that feature was not included in Dialogger. Several of the participants noted that they would like to have this feature added.
“it’s a little bit annoying that there’s no facility for that.” (P2)
Although faster than real time playback normally reduces intelligibility, this may be less of a problem if the transcript was available.
“you do still need to listen through, even though you’ve got the text. Therefore, it would be optimised if we could listen through quickly” (P4)
As listening is an important part of the production process, semantic audio interfaces would benefit from providing easy access to the underlying audio to allow multi-modal interaction. Once the link between the audio and the text is broken, re-linking the two together can be costly.
5.4.2.6 Drag-and-drop
In Dialogger, we used a drag-and-drop technique for users to create clips from various interviews and re-order them in a clipboard area. All of the participants were able to use this successfully, however we quickly encountered issues when dealing with longer clips.
“I found the interface quite clunky for pulling out big chunks of audio” (P5)
We performed our initial testing by pulling short clips, but for real-life usage, participants were mainly interested in creating large clips. This quickly filled up the clipboard area and users struggled to find the space to add more clips. This finding is in contrast to Sivaraman, Yoon, and Mitros (2016) which found that participants were mainly interested in making small edits.
P2 suggested modifying the interface so that clips were created by selecting the text and using a button to add the clip to the end of the clipboard. The problem could also be addressed by collapsing and expanding the clips to minimise the area they occupy.
5.4.2.7 Usability
Users could transfer their edits from Dialogger to a DAW by saving and opening a file. However, some participants wanted much tighter integration with the DAW, including bi-directional transfer of edits, so that edits made in the DAW were reflected in the semantic editor and vice-versa.
“Instead of thinking about it as a paper edit, if you think of it as the paper edit result of the sound edit” (P3)
None of the participants found the waveform display in Dialogger to be useful, and found it to be an unnecessary addition to the transcript text.
“You’re either working with text or working with the waveform. You don’t need both.” (P5)
Some participants also noted that they would prefer a cut-and-paste approach to copy-and-paste, as this prevents any duplication of content. This could also be achieved by marking which parts of recordings have already been used.
“When you have a big load of stuff, it’s comforting to know that you’re not duplicating your work.” (P4)
5.4.3 Metrics
5.4.3.1 Time

We recorded the time participants took to complete the observed tasks (see Figure 5.4.3.1.1). As various recordings of different lengths were used for the existing and new workflows, we divided the edit time by the audio duration to calculate the relative edit time. In all cases, the producers were able to run the ASR processing as a background task so this was not included in the calculation. P1, P2 and P3 used the semantic editor after their existing process, while P4 and P5 did the opposite. However, as different recordings were edited on each system, the presentation order is not expected to affect the results.
The mean average time for semantic editing was 0.79 minutes per minute of audio, versus 1.13 minutes for the existing method, which is a 44% improvement. However, a paired t-test revealed that there was no statistically significant difference (p = 0.24). This is due to the small sample size and the large variations in timings resulting from P4 and P5 not doing any logging, and P2 printing out and annotating their transcript before editing. Semantic speech editing may have the potential to reduce the time needed for logging and rough-editing material, but further investigation with a larger sample and consistent workflow is required to measure time performance.
5.4.3.2 Cognitive load
After completing both tasks in the observation, the participants were asked to rate both the old and new workflows using the raw NASA-TLX metrics (Hart and Staveland 1988). No significant differences were detected for any of the metrics using the paired t-test. With only five participants and marginal differences, it was not possible to draw any conclusions about cognitive load from these results. They indicate that Dialogger requires slightly less effort and mental demand, and is less frustrating. However, it is considered more physically demanding, temporally demanding and scores lower in performance.
5.4.4 Longitudinal deployment
After the interviews and observations were complete, the participants were given access to Dialogger for a further month (Stage 5). During this time their actions were logged electronically and they were emailed each week to ask which features they found useful, or were missing. P3 was unavailable immediately after the study, so could not take part in this stage.
Most of the comments received in the longitudinal deployment were already picked up by the first part of the study. In the remaining comments, all of the participants said they enjoyed being able to use Dialogger outside of the office and at home. Some reported that they had issues uploading content with their slow network connections, and P2 suggested that allowing multiple simultaneous uploads would allow them to leave it running overnight.
Participants were given access to the system for one month after the study. The logs from the interface were analysed to see how the participants used Dialogger during this stage of the study. All of the participants continued to use the semantic editor of their own accord as part of their work. The total time spent by the four remaining participants (P1, P2, P4, P5) using Dialogger in the month-long deployment period was 23 hours and 58 minutes. Over 14 hours of those were from P2, with P4 using it for 5 hours, P1 for 3 hours and P5 for 20 minutes. During this period, 86 recordings were uploaded and 58 audio edits were exported.
Users could navigate the content by either clicking on the waveform or by clicking on a word in the transcript. The interaction log showed that over 98% of navigation actions were executed by clicking on a word, which shows a clear preference for navigating by text compared to waveforms.
5.5 Discussion
We found that producers face a number of challenges with audio editing in radio production. There is often a large quantity of audio to process so it can take a long time. The content of the speech is usually complex and contains interconnections to things said in other recordings, which can be difficult to keep track of. Making editorial decisions also requires a high degree of concentration over an extended period, which is demanding, especially in the noisy and distracting office environment.
We observed that in their existing workflow, participants tackled these challenges by employing a number of techniques to filter and arrange their audio content. They started by listening back to all of their recordings, which allowed them to simultaneously assess the editorial content and sound quality of the audio. For long recordings, many participants logged the audio as they listened, by typing rough transcriptions and notes into a word processor, which they later used to help them edit the audio using a digital audio workstation (DAW). For short recordings, instead of logging, participants segmented their recordings in the audio editor during playback, and went back to remove unwanted segments and label the rest. All of the participants used a word processor to create a programme script in which they developed the structure and content of their story. They used annotations to highlight or rate the transcripts, and wrote notes to help them with selecting and assembling the final content.
We introduced a semantic editing system into professional radio production, which the study participants were able to successfully use as part of their workflow. On average, the semantic editing workflow was much faster than the existing workflow, in line with previous findings from Whittaker and Amento (2004), but this result was not statistically significant, so requires further investigation. We compared the semantic editing workflow, which included a transcript, to the existing workflow, which did not. Therefore, we were unable to measure how much benefit was derived from the transcript itself, compared to the semantic editing interface. All participants voluntarily continued to use the system after the trial, which indicates that they found value in using it. However, we identified a number of important features that were missing or could be used to improve future semantic speech editing systems. These related to listening, annotation, collaboration and portability.
5.5.1 Listening
Logging is an important process that primarily involves labelling and organising content, however it is time consuming. Some participants found the logging process to be valuable because it gave them the opportunity to listen back through their recordings, and make connections between various bits of content. This cross-referencing could also be assisted by providing links between words within and between recordings. For example, selecting a word could display and replay other mentions of that word in other recordings.
Another important reason for listening is to ensure a high “sound quality”. Participants wanted to avoid low quality audio such as “umm”s, mumbling, coughing and excessive background noise, but they also wanted to ensure they didn’t miss any high quality audio moments that might not have been identified using the transcript. Faster playback is already used in radio production to reduce the time spent listening to material, however more sophisticated time compression algorithms such as those described by Arons (1997) could be used. Time compression has not been included in previous semantic editing systems, but should be considered in the future, especially as Vemuri et al. (2004) found that the maximum time compression factor is significantly higher when an automated transcript is present.
Removal of “umm”s and breaths through de-umming is either done by the producer themselves or with the help of a sound engineer, depending on the producer’s experience and time pressure. To maintain sound quality, the removal of umms/breaths must be audibly transparent and participants reported that this can be difficult to achieve. Previous semantic editing systems have included functionality to remove umms (Berthouzoz, Li, and Agrawala 2012) and breaths (Rubin et al. 2013), however these were made possible because the manually generated transcripts explicitly transcribed those items. ASR systems are normally trained to ignore umms/breaths rather than transcribe them, which prevented us from including this functionality. A transcription system that includes these would allow us to add this functionality, however further research is needed into the extent to which de-umming can be automated in this way.
5.5.2 Annotation
All of the participants used a script document to structure and assemble their programme, and as a medium to inform and gather feedback from the presenter about the content and layout of the programme. Although the clipboard of our semantic editing system acted much like a programme script, the participants did not use it in that way because it was missing some key functionality for annotation and collaboration.
Annotation features were an important requirement that we did not pick up on during the design specification, and which have not been included in previous semantic speech editing systems. Two participants in our study deviated from the expected workflow in order to annotate the transcript, and the other participants noted the absence of such functionality. Participants wanted to be able to annotate the transcripts as they would with a word processor, in order to highlight or rate particularly good parts of their recordings, add personal comments, and to segment and label the content.
A simple change to achieving this would be to allow the transcripts to be formatted, and for textual comments to be inserted and edited. Furthermore, the drag-and-drop editing could be replaced with cut/copy/paste similar to Whittaker and Amento (2004) and Rubin et al. (2013). An alternative approach could be to add semantic speech editing functionality to a word processor, rather than adding word processing functionality to a semantic speech editor.
5.5.3 Collaboration
Scripts are used as a tool for collaborating with colleagues such as the presenter because the programme’s content and structure can be quickly reviewed and commented on by others without them having to spend time downloading and listening to the audio. Our semantic editing system was designed for individual access to transcripts and edits, however this meant that they could not be shared with the presenter. A better approach would be to allow multiple users to navigate and edit the same material. This could be achieved using operational transformation (Sun et al. 2004) which can support concurrent users editing the same content. Participants were also interested in tighter integration with the DAW. The same technology could be used to create bi-directional integration with DAWs, so that any edits made in the DAW are automatically updated in the semantic editor and vice-versa.
5.5.4 Portability
Participants reported that the open-plan office environment in which they worked was often noisy and distracting, and that they had difficultly working on screens for extended periods. As a result, many reported that they work from home to get away from the office or print transcripts so they can get away from the screen. A more portable semantic speech editing system would allow producers the flexibility to work where they wanted.
Digital pen interfaces such as the Anoto system could be used to create a paper-based semantic editor that can be used anywhere and does not involve screens. Additionally, it naturally supports freehand annotation and may be a better medium for face-to-face collaboration. Klemmer et al. (2003) has previously explored how speech can be navigated using paper transcripts and Weibel et al. (2008) describes how an Anoto system can be used to edit digital documents, however these approaches have yet to be combined.
5.5.5 ASR transcripts
Participants reported that the automatically-generated transcripts were sufficiently accurate for editing, supporting similar previous findings from Whittaker and Amento (2004) and Sivaraman, Yoon, and Mitros (2016). This is helped by the fact that radio producers record the audio themselves, and can use their memory to cope with inaccuracies. Most participants were only interested in correcting errors that were distractingly wrong, which were often names or locations related to the story. However, as these are known ahead of time, they could be provided to the ASR system as a way to tweak or expand the language model.
Currently transcripts of each programme are not published due to the high cost and overhead, however several participants were interested in fully correcting their transcripts so they could do this. The availability of ASR transcription could have the potential to extend the scope of radio production to include publication of transcripts. This could help to improve discoverability of programme content, especially if word timings were included.
5.5.6 Outcome
Based on the results of this work, we developed the prototype further to take into account the feedback from the producers in our study. We handed the prototype over to a development team at the BBC who turned it into an officially supported production tool. This has allowed producers from around the BBC to use the tool as part of their normal workflow. As of October 2016, the system had 45 active users and had processed 265 audio recordings.
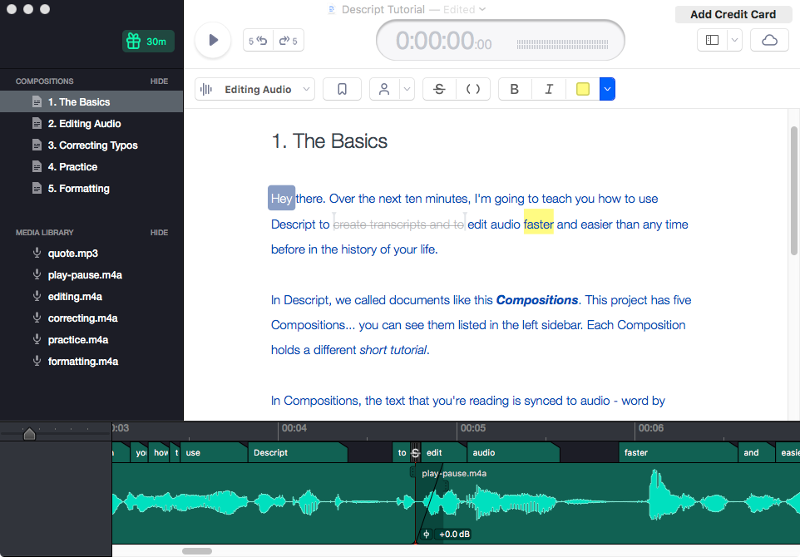
Independently of our research, in late 2017, a commercial semantic speech editing system called Descript was releasedhttps://www.descript.com/
. Descript is an audio production interface that uses ASR and manual transcription to allow users to transcribe and edit their audio. The interface, shown in Figure 5.5.6.1, includes annotation features such as bold, italic, highlighting and time markers. Rather than using a drag-and-drop technique for editing the audio, Descript uses strikethrough annotation to remove segments of audio. The transcript can be corrected by switching from editing mode to correction mode, and the transcript includes speaker diarization. In addition to these features, Descript includes an integrated waveform editor that can be used for fine editing and inserting cross-fades. This recent commercial interest in semantic speech editing suggests that there is interest in using this technology for audio production, and that ASR systems are now sufficiently accurate to support it.
5.6 Conclusion
We conducted a contextual study of semantic speech editing in professional radio production. The participants were able to use our system to produce real programmes and they continued to use it after the study. However, the results highlighted a number of opportunities to better address the needs of radio producers. Annotation features such as highlighting, ratings and comments are needed to aid producers in organising and structuring their content. Radio production is a collaborative process, so semantic editing tools should support multiple users. Use of operational transformation would allow concurrent editing and integration between multiple interfaces. Some participants struggled with office and screen-based working so portable interfaces, such as those offered by digital pen technology, would give producers the flexibility to work where they are most productive. Unwanted noises such as “umm”s and breaths must be removed transparently, which is done by the producer or sound engineer. By training ASR systems to transcribe these noises, this could be done in the semantic editor. However, further research is required into the sound quality achieved by this approach. Finally, “radio is made with your ears” so there are limits to how much editing can be done using a text-based interface. Editing tools should provide easy access to playback and use time compression features, which allow users to listen much faster, particularly in combination with the transcript.
6 Paper-based semantic speech editing
In Chapter 3, we found that two of the three radio production teams we observed used paper as part of their current production workflow. We also saw that all of the radio producers we observed used transcripts to help them navigate and structure their content. In Chapter 5, we saw that some radio producers found their work environment noisy and distracting, and did not like working with screens for extended periods. One of the study participants chose to print their transcripts as they found the production process easier to achieve on paper than directly on screen.
Working on paper offers a number of advantages over working on screens. Paper is lightweight, portable and does not require any power, which allows users to work almost anywhere. It is not back-lit, so is easier on the eyes. It can be navigated quickly, annotated freely whilst reading, and individual pages can be laid out and easily compared. Its physical low-tech nature also means that it is intuitive, robust, durable and does not crash or lose data. Reading from paper rather than a screen has been found to improve comprehension (Mangen, Walgermo, and Brønnick 2013), recollection (Singer and Alexander 2017), sense of structure and cross-referencing (O’Hara and Sellen 1997) and to be faster (And, Kurniawan, and Zaphiris 2001).
Radio producers can use paper to make hand-written annotations to help them structure their program and make editorial decisions. However, printing a document breaks the link to its digital source, so is normally a one-way process in which any information that is changed/added is not fed back. For example, when a producer uses the paper transcript to decide which parts of the audio they want to use in their programme, they must use a digital audio workstation (DAW) to manually execute those editorial decisions, which is a tedious and slow process. Creating a “digital bridge” between paper and its digital source may allow us to combine the advantages of paper and digital workflows.
In this chapter, we describe the design, development and evaluation of PaperClip — a novel system for editing speech recordings directly on a printed transcript using a digital pen. In Section 6.1 we review previous approaches to semantic speech editing and natural annotation of digital content. In Section 6.2 we describe our first study in which we worked with radio producers to design the layout of our system. In Section 6.3 we describe the design of PaperClip, which we developed in collaboration with a digital pen manufacturer. In Section 6.4 we explain the methodology of our second study in which radio producers edited content for their programmes using PaperClip, a screen interface and a normal printed transcript. We present the results in Section 6.5 which compares the strengths of the digital pen and screen interfaces, and shows how the accuracy of the transcript and listening affect the editing process. We discuss these results in Section 6.6 and present our conclusions in Section 6.7.
6.1 Background
Our system combines semantic editing of speech with natural annotation of digital content. As we saw in Section 2.4.3, previous semantic speech editing systems have all used screen interfaces. We identified three alternative types of interfaces that could be used to edit digital content: barcodes, digital pens, and digital ink. In this section, we explore each of these approaches and their applications.
6.1.1 Barcodes
Barcodes printed on paper transcripts have been explored as a method of navigating video recordings by using a device to scan the barcode and play the video from that position. Video Paper (Hull et al. 2003) was a system that printed video keyframes and barcodes down the side of a paper transcript. Each barcode linked to a position in a video, which was downloaded from a database and played on the scanning device. Books with Voices (Klemmer et al. 2003) was a similar system that tested this approach on oral historians who found it effective for assisting a transcript editing task. Erol et al. (2007) went a step further by embedding the video data in the barcode, removing the need for a database. HotPaper (Erol, Antúnez, and Hull 2008) removed the need for barcodes by using a camera to measure the whitespace between words and matching that to unique patterns in the text.
Barcode-based systems provide a link between text and media. They use real paper, can be annotated freely, are easy to generate and are robust to photocopying. However, they do not provide a convenient method of capturing annotations. It would be possible to use a handheld device to capture annotations and link them to a particular barcode. However, this would require the annotations to be entered into a handheld device, rather that just written on the paper. Additionally, the size of barcodes means that they cannot be used for each word, which affects the precision of the system.
6.1.2 Digital pens
A digital pen looks and functions as a normal pen, but includes an on-board infrared camera that tracks the position of the pen while it writes on paper. Digital pens must be used in combination with paper that has a unique non-repeating dot pattern printed onto it using a standard colour laser printer. By reading this pattern, the pen can calculate exactly where it is when touching the page. The pen records its position up to 100 times a second. Depending on the pen and software, this information can either be streamed live via Bluetooth, or downloaded as a batch onto a computer. The digital pens that use this patented technology (Fåhraeus 2003) are exclusively manufactured and licensed by Anoto Group. As such, this technology is commonly referred to as the Anoto dot pattern.
ChronoVis (Fouse et al. 2011) was a note-taking system that used the Anoto pattern for recording synchronised hand-written notes during playback of a video. An accompanying screen interface allowed users to click on the digital display of the handwritten notes to navigate to that position in the video. Weibel et al. (2012) conducted a longitudinal study of ChronoViz for use in observational research. The results show that notes became a mixture of linear notes and symbolic representations. Asterisks, stars, lines and simple shapes were used as bookmarks for later referral, or for counting events. The flexibility of freehand notes also enabled use of arrows in various contexts, such as to indicate direction and actions.
PADD (Guimbretière 2003) was a concept for a system of editing documents that used the Anoto pattern to allow users to move from digital to paper and back again. ProofRite (Conroy, Levin, and Guimbretière 2004) was the first full implementation of a PADD system, which overlaid annotations made on paper into a word processor. The annotations are anchored to the text, such that they “reflow” when the text is moved. Through informal feedback, users suggested that their annotations should translate into actions such as delete. PaperProof (Weibel et al. 2008) interpreted edit annotations and automatically applied them to the document. Gestures for delete, insert, replace, move and annotate were translated into modifications in a word processor, and intelligent character recognition was used to digitise any hand-written text. The interpretation of annotations allows for a two-way interaction between the digital and paper representations. We could not find any user studies of the PaperProof system.
6.1.3 Digital ink
Digital ink refers to technology that digitally captures and responds to the movements of a pen, such as a stylus. Typically, digital ink systems use a device with a backlit screen and a touch-sensitive interface like a tablet PC. Several systems have experimented with using a stylus with interactive sliders to provide advanced control for navigating video content. Examples include LEAN (Ramos and Balakrishnan 2003), Zlider (Ramos and Balakrishnan 2005) and MobileZoomSlider/ScrollWheel (Hürst and Götz 2008). However, these systems are limited to the navigation of content, without changing or labelling it. As we will see in this section, digital ink interfaces can also be used to annotate and edit media.
Marquee (Weher and Poon 1994) synchronised handwritten notes with a live video recording by using a horizontal line gesture to mark a timestamp. Dynomite (Wilcox, Schilit, and Sawhney 1997) synchronised handwritten notes to a live audio recording, and allowed the user to categorise their annotations using keywords, and to highlight regions of audio using a button. In the evaluations of each of their systems, Weher and Poon (1994) and Wilcox, Schilit, and Sawhney (1997) both found that users took fewer notes when using the digital ink system, and that they wanted to go back and use the audio/video to improve the notes afterwards.
Videotater (Diakopoulos and Essa 2006) was another digital ink interface for segmenting and annotating pre-recorded video clips. A vertical line gesture on a video timeline split the video into a clip, which could be labelled with handwritten notes. WaCTool (Cattelan et al. 2008) also included features for annotation, but added real-time collaboration and editing tools. Users could assign a “skip” command, which is analogous to removal, by pressing buttons at the start and end of an unwanted region. Video as Ink (Cabral and Correia 2016) allows users to “paint” video frames onto the tablet interface and then edit the video by erasing unwanted frames. Videotater, WaCTool and Video as Ink all rely on the manipulation of video thumbnails, which are unavailable in radio production.
Finally, as we saw in Section 2.4.3, RichReview (Yoon et al. 2014) allowed users to trim or tidy voice recordings by drawing a line through words or pauses to remove them. An evaluation with 12 students found that the editing features were considered easy to use and efficient for removing “umm”s and long pauses.
6.1.4 Summary
In this section, we have seen that barcodes, digital pens and digital ink have been used to link paper to digital media. Barcodes are a simple way to achieve this using real paper, which can be annotated freely and is easier to read. Although an additional device is needed to capture annotations, a camera on a mobile phone could be used to read the barcodes and play the digital content. However, barcodes only provide a one-way link from paper to media as annotations on the paper are not captured. Barcodes also occupy space on the page, which limits the precision with which they can be used.
Digital ink interfaces have both a screen and a stylus. This allows them to both capture freehand annotations, and respond by replaying the original media, or erasing mistakes in the annotations. However, as digital ink interfaces use screens, they do not benefit from the improved reading speed, comprehension and cross-referencing of paper. They are often bulky, have a short battery life, and in the event of battery or device failure, the transcript and annotations are lost. Electronic paper is a technology that attempts to emulate the benefits of reading from paper. Although it has been commercially successful through its use in e-readers, studies have found that e-paper has a higher reading time, worse comprehension and higher eye fatigue than reading from normal paper (Jeong 2012; Daniel and Woody 2013). Additionally, we could not find any systems that provided the level of interaction that would be needed to mark-up a transcript.
Digital pen interfaces combine many of the benefits of both barcode and digital ink interfaces. They use physical paper, which is better for reading, but also allow a two-way interaction by capturing freehand annotation. The pen-based interface is natural and familiar, and because the annotations are made on the paper itself, information is both accessible and backed-up in the event of device or battery failure. However, a colour laser printer must be used with proprietary software to print the required dot pattern, and the printouts cannot be photocopied. There is no easy way to undo or erase annotations, although this is an inherent problem with pens in general. We have seen that digital pen technology has successfully been applied to text editing (Weibel et al. 2008) and media annotation (Fouse et al. 2011), but we could not find any previous literature which has combined these approaches to allow semantic editing of speech content.
6.2 System requirements
We developed a paper-based semantic speech editor for radio producers, to explore how it affects the production process. In this section, we describe how we evaluated a mock-up prototype to gather requirements for the design of our system.
We chose to use digital pen technology because it uses paper, which provides better readability, and can capture natural handwritten annotations. Due to the lack of open development platforms, we collaborated with the digital pen manufacturer Anoto to build our system. We used their LiveForms platform, which allowed us to capture digital information from handwritten annotations. The system worked by dividing a page into rectangular active zones. When a compatible digital pen drew inside one of these zones, that data was captured digitally and processed.
In order to build our system, we needed to design the layout of the paper document and define a set of gestures for editing the audio. As there were no previous systems on which to base our design, this process raised a number of questions about what information we should include in the layout, and which gestures we should use for interaction. Specifically we were interested in answering the following questions:
How do producers currently annotate transcripts?
Do producers prefer to select or remove content?
Which additional features (e.g. timestamps, speaker labelling, confidence shading) should be included with the transcript?
To answer these questions, we used paper prototyping to create a mock-up of our paper interface. For the mock-up, we used a normal pen rather than a digital pen. This did not process the gestures, but otherwise provided an identical experience. This allowed us to test an initial design of our interface with users before building the functional system.
6.2.1 Mock-up design
In the results from Chapter 5, we saw that radio producers annotated paper transcripts using underlining (for selecting words), strikethrough (for removing words) and drawing a line down the side of the page (for selecting whole lines). We used this information as the basis for the design of our mock-up system, shown in Figure 6.2.1.1.
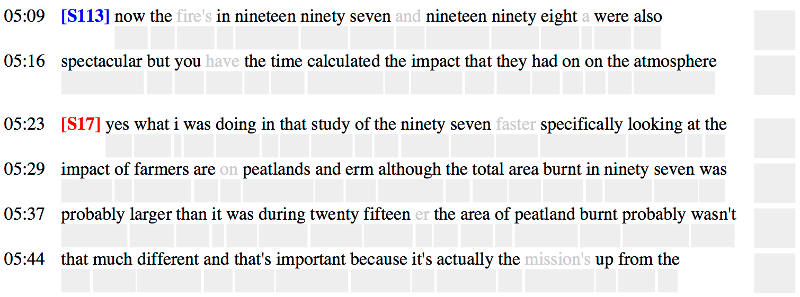
We used an ASR transcript and included the additional information that was generated by the ASR system. We wrote a timestamp at the beginning of each line in minute:second format, and used confidence shading (Vemuri et al. 2004) to “low-light” words with a low confidence score by shading them grey. We also put a paragraph break at speaker boundaries and wrote the speaker label at the start of each paragraph. To distinguish speaker gender, we coloured the speaker label blue for males and red for females.
To be able to capture timed edit commands using the LiveForms system, we designed our layout to use rectangular active zones that aligned with the location of each word. We placed an invisible active zone over each word to capture strikethrough, a shaded active zone under each word to capture underlining and a square shaded active zone at the end of each line to capture lines down the side.
6.2.2 Mock-up evaluation method
To evaluate our proposed layout, we recruited five radio producers (P1–P5) from BBC Radio to use our inactive prototype to annotate real transcripts as if they were editing them. Two of the participants worked in current affairs, two in science and one in documentaries. The participants had between 7 and 13 years experience in working as radio producers. Producers are very busy, so to recruit enough participants in the time available, we designed the experiment to take less than one hour. To make the study as realistic as possible, we asked each participant to provide a recent interview recording they had made, which we used to generate an ASR transcript.
To help explore our questions about annotation and editing gestures, we directed participants to employ three different strategies when using the prototype. This forced them to try different ways of interacting with the prototype, which they could later reflect on and compare. As part of the evaluation, we were interested in learning what gestures producers currently use, or want to use, without being influenced by the design or constraints of the prototype. We were also interested in directly comparing the underlining and strikethrough strategies.
We instructed the participants to follow the directions below for the first three pages of their transcript.
Page 1: Undirected — Edit the speech by annotating the transcript as you would normally.
Page 2: Underlining only — Edit the speech only by underlining words that you want to keep.
Page 3: Strikethrough only — Edit the speech only by putting a line through words you don’t want to keep.
To evaluate speaker labelling, we excluded the labels from the first three pages, then included them on page 4 and asked the participant to edit the speech how they wished. Timestamps, line selection and confidence shading were included with all of the prototypes as we expected participants to be able to judge their value in situ.
After the editing task, we conducted a semi-structured interview with each participant. We asked the following questions, but also allowed participants to talk freely.
How do you normally use a pen to edit the transcript?
Do you prefer to select parts you want to keep, or remove parts you don’t want to keep?
Which features of the prototype did you find useful?
Were there any features missing that you would want added?
We categorised their responses into natural gestures, edit gestures and additional features. We counted the frequency of each response within the categories to compare the popularity of the features and editing strategies.
6.2.3 Mock-up evaluation results
The reaction to the system was overwhelmingly positive. All of the participants could immediately see the value of such a system and most remarked that it would save them significant amounts of time.
Table 6.2.3.1 lists the gestures that the participants used when editing undirected on pages 1 and 4. Each participant naturally used a different mixture of gestures for selection, removal, correction and labelling. The most common gestures for selection were underlining and line down side, with strikethrough being the most common removal gesture. Most participants combined line down side for large selections with underlining and strikethrough for finer edits.
We asked each participant whether they preferred selecting or removing words when editing the transcript. P1, P3 and P4 reported that they preferred selecting, with P2 and P5 preferring to remove words. P1 commented that selecting “felt more natural” to them, and P4 said deleting felt “counter-intuitive”. P2 and P5 reported that they preferred deleting words. P2 commented that “the challenge is to nibble away” and it was “the way my brain works”. P5 said they prefer to “get stuff out of the way”. All of the participants were certain about which they preferred, but there was no overall consensus. Additionally, Table 6.2.3.1 shows that most participants used a mixture of select and delete gestures during the undirected stage.
Four of the five participants said that they found the paragraphs and speaker information useful. Typically, interviews are recorded with a presenter and contributor, and the participants said they found it valuable to know when the presenter is asking a question. Three of the participants said that they were able to find the questions much more easily with this feature enabled. However, P2 said they found the speaker diarization to be “distracting”, particularly when it was inaccurate.
All participants said they found the timestamps and confidence shading features useful, but P2 said that the timestamps are “not needed on every line” and P5 suggested that one timestamp per page would be sufficient.
All of the participants liked being able to select whole lines at a time. P5, who prefers to remove words, asked whether a similar function could be available to delete content.
During our testing, some participants suggested adding features that were not included, or used the prototype in a way it was not designed. P3, P4 and P5 remarked that they often highlight important bits of transcripts, usually with asterisks or stars. P1 and P3 also suggested extending the underlining gesture so that underlining twice marked words as being more important. Three participants used what little space there was at the side to label the content and make notes for themselves, and P1 and P5 corrected mistakes in the transcript by writing over or above the incorrect word.
6.2.4 Requirements
The results of our mock-up evaluation showed how radio producers currently annotate transcripts, that there are mixed opinions on whether to select or remove content, and that they valued the additional features tested. We also discovered additional requirements for margins and highlighting that were not initially identified. We will now use these results to produce a set of design requirements for our system.
Edit gestures The most common edit gestures used by participants were underlining, strikethrough and line down side, with the other gestures being used less than half as often. This confirms our initial assumptions, so our design should use these gestures for editing operations.
Select vs remove There were mixed but strong opinions on whether participants preferred to select or remove content, and most used a mixture of both. This indicates that both selection and removal should be made available. In cases where both are used, remove should override select as this would allow users to draw a line down the side to select large chunks and to cross-out individual words within those.
Additional features Most participants valued speaker diarization, timestamps and confidence shading, so these additional features should be included. However, some participants reported that timestamps on every line are unnecessarily frequent and that one per page would suffice.
Margin Three participants made notes on the side of the page to label their content or to make a note for themselves, and two suggested adding a margin. With the LiveForms system, writing notes on the transcript itself would trigger the active zones that are on and below each word. Our design should include an inactive margin, as this would allow users to make freehand notes without inadvertently making edits to the speech.
Highlighting The ability to highlight regions of interest was a desired feature. Two participants suggested double underlining could be used to achieve this, however, this may be hard to detect using the LiveForms system. Alternatively, by giving the user an option to keep all of the content except for deleted words, underlining could then be used to highlight parts of interest. This mode-switching design would give the user greater flexibility in how they use the system.
6.3 System design
Using the requirements gathered from our mock-up evaluation, we designed and implemented a working prototype of the paper-based semantic speech editing system. Previous semantic speech editing systems have used screen interfaces. In order to have a baseline by which to compare the effect of paper-based semantic editing on radio production, we also implemented a screen interface. This section describes the design and implementation of both of these systems.
6.3.1 Paper interface
Based on our findings, we used underlining, strikethrough and line down side as the edit gestures, and included speaker labelling and confidence shading. We retained the timestamps, but reduced their frequency to one per paragraph, rather than on every line. We added an inactive margin to allow users to write freehand notes without the risk of accidentally editing the audio. We did this by drawing a rectangular box on the right side to indicate where the user could safely write. We set the width of the margin to be approximately 25% of the width of the page, based on informal feedback from producers. Due to the wide variety of annotations that producers use, we did not attempt to capture structured notes.
We collaborated with Anoto to implement PaperClip using their LiveForms platform. As this platform did not allow us to combine underlining and strikethrough gestures with handwriting recognition, we could not include correction functionality. We did not include integrated playback control, as this would require a wireless link to the digital pen, which the platform did not support.
We used two active zones for each word — one on the word to detect a strikethrough, and one below the word to detect underlining. Drawing inside a zone would mark that word as either removed or selected, respectively. We lightly shaded the zone below each word to make the boundary visible. We drew a long thin rectangle between the transcript and the margin for capturing a line down the side. The final design is shown in Figures 6.3.1.1 and 6.3.1.2.

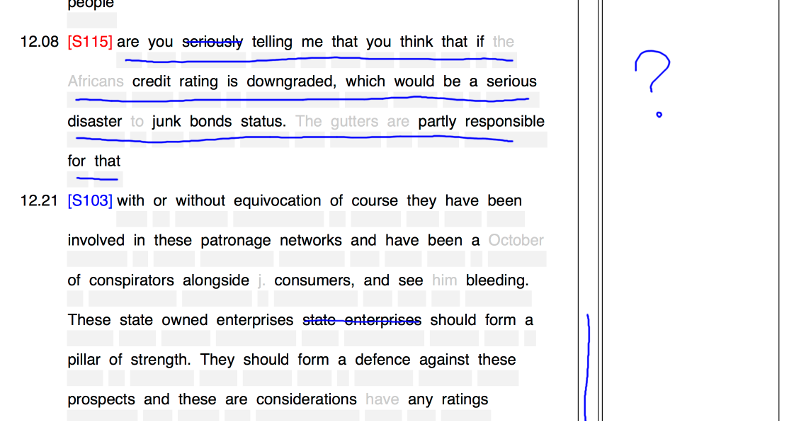

Editing was performed using an Anoto Live Pen 2 digital pen, which tracked and digitally recorded the gestures made on the transcript. When the pen was connected to a computer via a USB dock, the gestures were processed and translated by the Anoto system into edit commands. We integrated PaperClip with our screen interface (see Section 6.3.2) to handle audio import, printing transcripts, viewing/changing edits, viewing the margin notes and exporting the edits. A diagram of this integration is shown in Figure 6.3.1.3.
We supported two export formats — audio as a WAVE file, or an edit decision list (EDL) for the SADiE or StarTrack DAWs. PaperClip also created a PDF document of the transcript that showed the user’s annotations, which could be viewed through the screen interface.
6.3.2 Screen interface
For the screen interface, we updated the system we developed in Chapter 5 to implement some of the changes suggested by our findings. The original design can be seen in Figure 5.2.5.1, and the updated design is shown in Figure 6.3.2.1. The original design used a drag-and-drop system for creating clips from selected text. We replaced this with underlining and strikethrough gestures to provide better support for large selections, and to align with the design of PaperClip.

We added a double-speed playback feature to allow faster than real-time listening, and a “save-as” feature to allow multiple edits of the same material. We implemented this by using collapsible sidebars to separate the original “media” on the left, from the modified “edits” on the right (see Figure 6.3.2.2). We also included speaker diarization using a label and line down the side of each paragraph, coloured by gender, and included confidence shading using a dotted red underline to match the style of word processors.
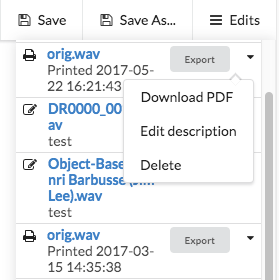
The screen interface included integrated playback, which allowed the user to listen to and navigate the audio while they edit. The current playback position was shown in the text and the user could jump to a word by double-clicking it on the transcript. Any edits made to the transcript were reflected in the audio. The user could also correct any mistakes in the transcript by editing the text as they would in a word processor.
6.4 Evaluation methodology
The objective of our second study was to discover whether professional radio producers could use PaperClip as part of their workflow, and to compare how the workflow was affected by PaperClip and our screen interface. To find out, we ran a within-subjects qualitative user study in which we tested radio producers editing speech recordings under three different conditions:
PaperClip digital pen interface
Screen interface
Normal printed transcript
We did not want to test the impact of the transcript itself, but rather the impact of the interface that was used to interact with the transcript. Therefore, all three conditions used a transcript generated by the same ASR system, developed by the BBC. Our ASR used the Kaldi toolkithttp://kaldi-asr.org/
and was trained on television recordings. The normal printed transcript acted as a control. It included speaker labels and timestamps, but did not use the PaperClip layout or Anoto dot pattern.
We recruited eight radio producers from the current affairs, science and documentaries teams in BBC Radio. Table 6.4.1 lists the participants and their self-reported professional experience and the department in which they work. Only one of the participants overlapped with our first study in Section 6.2. As producers are very busy, we designed our study to take less than a day to complete. Despite this, it took us 12 months to recruit the participants and collect the data as producers often cancelled or re-arranged due to their demanding role.
| ID | Experience | Department |
|---|---|---|
| P1 | 13 years | Current affairs |
| P2 | 16 years | Documentaries |
| P3 | 8 years | Current affairs |
| P4 | 10 years | Science |
| P5 | 18 years | Current affairs |
| P6 | 16 years | Current affairs |
| P7 | 28 years | Documentaries |
| P8 | 20 years | Science |
6.4.1 Protocol
The protocol for our study had three stages.
Stage 1: Training Firstly, the participant was briefed on the study and asked to sign a consent form. The participant used a test recording to perform a scripted series of tasks that used all of the features of each interface. This allowed them to use and experience all of the features for themselves. The participant was then given an opportunity to ask questions and become familiar with each interface until they felt comfortable with using them.
Stage 2: Observation The participant completed three editing tasks, each under one of the three conditions (C1, C2 or C3). The order of conditions was balanced to avoid carryover effects. We designed the experiment so that the editing tasks overlapped with the work the producers already needed to do. This ensured that the tasks were genuine and part of a real production. The participant provided three recent speech recordings that they needed to edit so that the content was fresh in their mind. We needed to use different recordings for each condition, but we asked the participant to choose recordings from the same programme to ensure they were as similar as possible. In Chapter 5, we found that there was no benefit in using transcripts for short recordings, so each recording was at least 20 mins in length.
The investigator observed the task, made written notes about their behaviour, and logged the duration of each audio file and the time taken to edit it, excluding any interruptions. Items of interest at this stage included editing workflow, tools used, data generated, usability challenges and problems, navigation and edit actions, time taken to complete tasks, unexpected reactions and unanticipated usage. During any “down-time”, we conducted ad hoc, in situ interviews to clarify the process and any decisions that were made. The observation took place at the participant’s normal work environment, which in all cases was a desk in an open plan office. We considered recording the task using a video camera, but due to the open-plan nature of the offices, there were insurmountable issues with privacy and information security.
After each task, the participant filled out a questionnaire to measure the usefulness and usability of the interface, using the Perceived Usefulness scale (Davis 1989) and the Software Usability Scale (SUS) (Brooke 1996), respectively. After completing all three tasks, the participant was asked to select which system they would prefer to continue using.
Stage 3: Interview The investigator conducted a semi-structured interview using the following questions. The order of questions 2–4 was adjusted to match the order in which the conditions were presented to the participant. An audio recording was made of the interview for later analysis.
Can you please describe your existing process for editing audio?
What did you like or dislike about the pen-based system?
What did you like or dislike about the screen-based system?
What did you like or dislike about using normal paper?
Overall, which of these systems would you most prefer to continue using, and why?
6.4.2 Analysis
We transcribed the interview recordings and corrected the words manually using the screen interface described in Section 6.3.2. Using thematic analysis (Braun and Clarke 2006), the investigator then openly coded the transcripts and observation notes using RQDA (Huang 2016), which produced 229 initial codes. The investigator then used FreeMind mind-mapping software to group the codes into categories, and the categories into themes.
The time taken to edit an audio file depends upon its length. As recommended by Dewey and Wakefield (2014), we divided the edit speed of each task by the audio file duration to calculate the “normalised task completion time”. Following the procedures described in Davis (1989; Brooke 1996), we converted the questionnaire data measuring the usefulness and usability into individual scores between 0 and 100. We used within-subjects one-way ANOVA (Rouanet and Lépine 1970) to test for differences between the systems in the relative edit time, perceived usefulness and usability (SUS) metrics. For the system preference data, we simply report the count of the preferences for each system.
6.5 Evaluation results
In this section, we will present the quantitative and qualitative results that emerged from the metrics, observation notes and interviews in our evaluation study. The themes and categories that resulted from the analysis of the interview transcripts and observation notes are shown in Table 6.5.1. We will start by looking at the metrics and user preferences we gathered, before summarising the comments made by participants in each of the categories and themes that emerged from the thematic coding process.
| Theme | Category | # codes |
|---|---|---|
| Editing | Collaboration | 15 |
| Annotation | 16 | |
| Location | 11 | |
| Export | 7 | |
| Pen | 35 | |
| Technique | 24 | |
| Decisions | 12 | |
| Interface | 21 | |
| Transcript | Paper | 15 |
| Accuracy | 17 | |
| Generation | 10 | |
| Correction | 12 | |
| Listening | Navigation | 8 |
| Criteria | 14 | |
| Technique | 12 |
6.5.1 Metrics

When asked which system they would prefer to continue using, four of the eight participants chose PaperClip, two (P3 and P6) chose the screen interface and two (P1 and P4) chose the normal paper transcript. Although it did not include any semantic editing functionality, P1 and P4 said they preferred the normal paper transcript as it allowed them to use their existing workflow and tools, which they found easiest and most comfortable. This demonstrates that ASR transcripts themselves are beneficial to radio production.
Figure 6.5.1.1 shows the mean average scores of the usefulness and usability of the three systems. A one-way within-subjects ANOVA showed that there was no statistically significant difference between the systems for usefulness [\(F(2,14)=0.788, p>0.05\)], nor usability [\(F(2,14)=1.068, p>0.05\)].
The SUS metric produces a numeric score between 0 and 100, which can be used to directly compare the usability of different systems. The reported SUS scores of systems from other studies can be used to convert our scores into a percentile figure that shows how they compare to other interfaces in general. Sauro and Lewis (2016, p. 204) proposed translating this percentile score into a grade between F and A+ to describe the result in human terms. The grades for our normal paper, screen and pen interfaces were A, B and B–, respectively, which shows that all of the tools appear to perform well overall. However, as this technique does not take into account the purpose of the interfaces, it cannot tell us how usable our interfaces are compared to other semantic speech editors.
For each task, we divided the edit time by the audio duration to calculate the relative edit time. The screen and normal paper interfaces had the same mean relative edit time (\(\times 0.99\) real-time), but PaperClip was 16% faster (\(\times 0.83\) real-time). This was surprising, as we expected the screen interface to be faster than both the pen and normal paper due to its integrated playback feature. However, a one-way within-subjects ANOVA did not find any statistically significant difference [\(F(2,14) = 0.931, p > 0.05\)].
The metrics results show that although half of participants preferred the PaperClip interface and it had the fastest relative edit time, it was rated least useful and least usable. To try to better understand these ratings, we now turn to the interview and observational data.
6.5.2 Editing
6.5.2.1 Decisions
Participants P4, P5 and P8 reported that they could make editorial decisions faster and more easily on paper compared to the screen because of the reduced functionality of the interface, uninterrupted playback of the audio, natural edit gestures and faster reading speed. P4 said that the lack of correction features in PaperClip allowed them to edit faster than the screen, as it didn’t interrupt their flow.
“I liked how it limited my options, [...] because with the screen I think what slowed me down was the fact that I could be [...] simultaneously correcting the transcript and trying to edit the content. [...] With the pen, I couldn’t, so there’s no point stopping. [...] I don’t think I’ve ever done an edit that fast, where it was literally real-time.” (P4)
P2 and P5 reported that they could process the information faster when reading on paper compared to the screen. P5 said that when using the screen, they would select more than necessary because their decision-making couldn’t keep up with the audio.
“The [screen] felt too quick and much harder to make a decision. It was like ‘just keep everything’, because you don’t want to miss something.” (P5)
P8 said they felt that the digital pen allowed them to be more precise with their edits than with the screen. Although the screen is just as precise, the digital pen can be used to start making a selection without knowing the endpoint. This allows the producer to decide as they listen, which may give a feeling of better control over precision.
6.5.2.2 Pen
P5, P6 and P8 felt that the physicality of the PaperClip interface made it user friendly, intuitive and simple.
“It feels like you’re working analogue, but you’re actually working digitally. [...] It’s nice to hold a pen and go on real paper, which has the feel of every day life.” (P7)
The design of PaperClip forced users to select or delete content by drawing lines within strictly defined zones that are interpreted literally. P3, P5, P7 and P8 said they did not like that they could not freely draw on the page and were concerned about potential errors that could be introduced by straying outside of the boundaries.
“[PaperClip] doesn’t have the convenience of paper, which is that there’s no real rules [and] you can write anywhere on the paper.” (P3)
P3 and P6 said that they did not like that there wasn’t any way to undo the edits using PaperClip. P6 suggested that the lack of undo functionality may force them to be more decisive.
“It’s harder to say ‘oh no I’ve changed my mind, I want to go back’, so you almost have to be much more decisive, which maybe is a good discipline.” (P6)
P2, P3, P5 and P7 were interested in the cost of the pen as they were concerned about losing or breaking a potentially valuable item. P3 and P5 noted that other valuable items, like headphones and recorders, are normally shared amongst producers in a team but that they often disappear or get broken.
“Pens which are not connected to anything will go missing and get lost. [We have a] constant problem with headphones going missing in this department [...] and the solution is that the headphones are actually bolted to the desks.” (P3)
Often transcripts can be very long, so printing them requires a large amount of paper. P2 used a long recording for the experiment that required over 50 sheets of paper, which they said was “quite wasteful”. The Anoto system also requires access to a colour laser printer. This is not usually a problem in an office environment, but can be an issue when travelling, or when working from home.
6.5.2.3 Collaboration
Radio producers work with a variety of people including presenters, assistant producers, contributors and organisations. P3, P6 and P7 said that transcripts make it easier to collaborate as they create a common reference point that is easy to share and annotate.
“The way we’re doing it is printing out our transcripts and we can all go ‘page 15’ [...] there’s a common reference, whereas if you’re just doing audio it’s harder.” (P6)
The physical nature of paper allows people in the same room to hand around transcripts, point at words and lay pages out. However, the digital nature of the screen means it can be used for remote collaboration. For example, P6 reported that they use Google Docs to simultaneously write and edit the script remotely with the presenter.
“I think of the three, [the screen] has the most potential to be a collaborative thing. [...] Maybe if you could have two scripts side by side to have my transcripts with my bits highlighted and the presenters, with their bits highlighted.” (P6)
6.5.2.4 Location
P1, P5, P7 and P8 said that they often prefer to work away from the office, such as at home, to help them focus and get more work done. P7 and P8 suggested that PaperClip was well-suited for travel, such as during commuting, which may provide an additional opportunity to be productive in what would otherwise be considered downtime. Although, P7 pointed out that the screen interface could be used on-the-road with a laptop and noise-cancelling headphones.
“With the pen you could do stuff on the train [...] or on a bus. You could do it anywhere as long as it’s not too bumpy.” (P8)
P5 said they did not enjoy spending too long sitting upright at their desk, and P7 cited comfort as a factor in where they prefer to work.
“I would feel more comfortable with a nice digital pen and a sheet of paper sitting on a couch [...] You could do it in bed - that would really have your work-life balance sorted, wouldn’t it?” (P7)
6.5.2.5 Technique
P1, P2, P6 and P8 reported that editing was an iterative process. P2 said this was because they are not sure what they need in the early stages, so they select too much then reduce it later. P8 said that what they select, or how much they select, depends on what was said in other interviews, and P1 said they often have to go back to re-edit clips in a different way.
P1, P6 and P8 reported that all three systems we tested were only suitable for the first iteration, known as a “rough edit”, because they were missing two features — re-ordering and labelling. Re-ordering is used to to see and hear how different clips from separate interviews would work together, and labelling is used to help the producer navigate, organise and structure their content.
P5 used annotations to segment and label the transcript (see Figure 6.5.2.5.1), which helped to structure the material.
“I was just labelling by summarising a paragraph in about two or three words — just who is speaking and the substance of it — or maybe just putting a cue to say that was a question.” (P5)
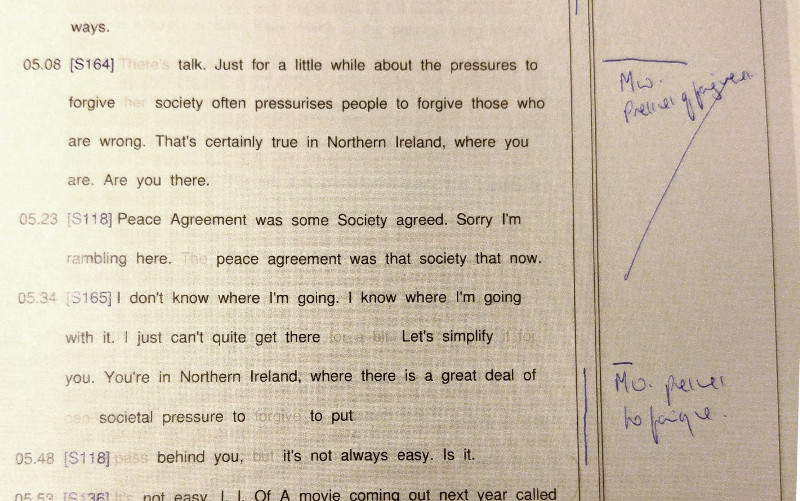
By capturing this information in a structured way, it could be exported as part of the EDL to guide the producer in later stages. P3 suggested that it might be possible to automatically generate labels using the text of a selected clip.
“If it was to dump those separate clips in your [system] and name them according to the text, then that would save twenty minutes suddenly in a single go.” (P3)
6.5.2.6 Annotation
PaperClip used an underlining gesture to select words, but P1 and P6 both suggested that they would prefer using a highlighter pen style mark. This would also mean that the transcript wouldn’t have to be double-spaced, but it would require a system that can distinguish between a strikethrough and highlight.
Participants used different marks to rate the importance of their selections, including stars and asterisks, which we witnessed previously in Chapter 5. However, both P2 and P6 suggested using colours as a way of marking up different selections. This could be used as a rating system, where one colour is considered more important than other, or as a categorical system for whatever context is appropriate to that producer.
“Maybe if you had different colours you could mark your first one in red [then] change colour and underline it a second time.” (P6)
6.5.2.7 Interface
The lack of integrated audio playback and navigation in the pen interface made it more difficult for participants to navigate the audio content. Although participants could use a separate playback device to navigate the audio, they either had to do this “blind”, or use the timestamps on the transcript to guide themselves to the desired position. With the screen interface, participants could use the text to see where they were navigating to, making it much easier to move around non-linearly. We observed that when using the pen interface, many participants chose to edit while listening straight-through, without navigating the audio at all.
The ease of navigation offered by the screen interface may make it better suited to editing recordings where producers are more reliant on listening to the audio. This could include content with which the producer is less familiar, such as a recording they were not present at, or a recording from the archive.
“I think if you’re in a rush, and you know roughly what you’ve got, and it’s an interview that’s close to memory, then the pen’s really good. I think if you want to get into the guts of the interview, [...] then you’re going to want to work on the screen.” (P7)
6.5.2.8 Export
Both the screen and pen interfaces that we tested included a feature to export an edit decision list (EDL) to a DAW. This allowed the participants to integrate with their existing workflow by being able to make changes to their edits using their existing tools. P2 and P6 expressed frustration that annotations were not included in the export.
“Once you have put it into SADiE you have to [label the content] again. It’s almost like you’ve gone forwards then you have to take half a step back and you lose a bit of momentum.” (P2)
The other frustration with the export feature was that in the EDL, the selected clips were all pushed together without any gaps. P3, P5 and P6 said that they would like there to have been gaps between clips, so that it would be more obvious where the edits are when listening back. Instead of using gaps P5 and P8 moved their selected clips to a different track in the DAW when editing with the normal printed transcripts. This also allowed them to see where the clips were located in the original recording.
6.5.3 Transcript
6.5.3.1 Paper
Most participants commented that working with paper had a number of benefits to their workflow. P2, P5 and P8 said they found it easier to read from paper than screen. P1, P2, P6 and P7 said that it was easier on the eye and gave them a break from working on screen. P2, P5 and P7 said they enjoyed that paper was a physical, tangible medium which they could touch. P1 and P5 commented that using paper transcripts made it easier for them to orientate themselves.
P1 said the paper interface allowed them to think more widely, and P8 reported that they found it easier to remember the content of the transcript when reading on paper rather than a screen.
“I find it easier to read off paper, and easier to remember stuff.” (P8)
“It’s essential to print [because] I have to think more widely. What bits am I going to put where? What’s my structure? Where am I going to put this bit? Mentally, it is easier for me to refer to the [paper] transcript so that I know where everything is.” (P1)
6.5.3.2 Accuracy
All of the participants were successfully able to use the ASR transcripts to edit their material as part of the production of their radio programme, and all reported that the transcripts were sufficiently accurate for the purpose of editing their content. Similarly to what we found in Chapter 5, the most common complaints were of reduced accuracy due to heavy accents or background noise, and problems with speaker labelling and confidence shading. For example, the ASR system would occasionally give a high confidence score to an incorrect word, or a low confidence score to a correct word, which caused P3 to mistrust the confidence shading.
“The things it wasn’t sure about weren’t actually very often the real mistakes.” (P3)
P6 normally works with perfect transcripts and found that the errors by the ASR system caused them to rely more on the audio than they normally would, although P7 and P8 said they could use their memory to ignore many of the mistakes in the transcript. P8 reported that lower accuracy transcripts caused them to make rougher edits than they would normally.
6.5.3.3 Correction
We observed that all of the participants chose only to correct errors that impacted on their ability to read the transcript. P2, P4 and P6 said that gross inaccuracies in the transcript distracted them, which caused them to read more slowly and reduced their editing speed.
“It’s good to have the option to sharpen it up as you go along because, obviously, reading back it’ll slow you down if it’s completely the wrong word.” (P2)
We observed that the ASR system would often make repeated mistakes on an unknown word by mistranscribing it as a variety of words, which made it difficult to fix. This usually occurred with names of contributors, or words specific to the topic of the programme. P3 and P7 asked whether it would be possible to provide custom training to the ASR system to tailor it for their specific programme.
“If you’re doing a story about AIDS, there’s going to be stuff about anti-retrovirals [...] The ability to teach it some words would be really good.” (P3)
6.5.3.4 Generation
The participants in this study re-iterated the finding from Chapter 5 regarding frustrations with manual transcription and the benefits of having the transcript automatically generated. P1 and P3 stated that the ASR element was the largest benefit of the semantic speech editing systems, as it freed up that time.
“The transcription thing for me is eighty percent of the advantage.” (P3)
P7 reported that they already make regular use of a commercial ASR system called VoiceBasehttps://www.voicebase.com/, accessed 18/01/2018.
to automatically generate transcripts. P5 had previously tried a different commercial system called Trinthttps://trint.com/, accessed 18/01/2018
, but could not continue due to the cost. None of the other participants reported having used automatic transcripts as part of their existing workflows.
6.5.4 Listening
6.5.4.1 Criteria
All of the participants chose to listen to the audio while editing with the transcripts. They gave four reasons for doing so: processing information, efficient navigation, judging quality and identifying non-speech sounds.
P1, P4 and P6 reported that listening while editing made it easier for them to process the information that was being communicated in the interviews. P1 and P6 said this helped them to find where corrections needed to be made and to find words that were inaudible or not actually present. P2 and P8 suggested that the multi-modal input of listening and reading helped them to understand the content and make edit decisions.
“I think reading and listening at the same time makes it easier to take that amount of information on. It’s going into two sensory inputs so it’s easier.” (P8)
Although a transcript can tell you what was said, it does not tell you how it was said. This can change the meaning of the words, and make the difference between an edit that works or not. One thing the participants were looking out for were any low quality sounds such as “umm”s and breaths, which are distracting to listeners and can reduce the intelligibility of the speech. The ASR process does not attempt to transcribe “umm”s, breaths or non-speech sounds. This means that producers must listen to identify these. P7 and P8 showed an interest in using the transcript to remove these noises.
P1 was interested in hearing the direction of intonation, that is, whether the voice rises or falls in pitch. The intonation at the end of a clip must match the beginning of the next clip, otherwise it will be apparent to the listener that the two have been cut from different parts of a recording. Such information is not visible using the transcript.
“It could be that [...] the intonation is going up and it won’t work as a clip, so I need to hear it.” (P1)
6.5.4.2 Technique
P4, P6, P7 and P8 all said that they sometimes edit using only the audio itself. When the audio recording is short enough that the producer can remember what was said and where, then there is less need for a transcript. P4 put the cut-off threshold as 15–25 minutes.
“For interviews that are under 15 minutes, I can hold the whole thing in my head. [...] For things that are over 25 minutes, then that’s when [transcripts] start to become useful.” (P4)
Some programmes focus more on the auditory experience than the words by combining field recordings, sound effects and music. In these cases, there may be little benefit in using transcripts at all.
“If I was making a heavily ‘actuality-led’ programme, I wouldn’t bother with those sort of transcripts because what you want is the sense of the sound, of its audio environment.” (P7)
P1 and P7 reported that their existing editing workflow often involves re-listening to the material they recorded in full, “from beginning to end” (P1). They reported that this allows them to refresh their memory, and to start making decisions on what to lose or to keep. P2 said that they found manual transcription to be a good opportunity to re-listen to material for similar reasons. Although removing the requirement to manually transcribe recordings reduces the burden on producers, there is a risk that it takes away an opportunity to re-listen to material. This may introduce an unintended negative impact in that edit decisions are based more on the words that are spoken and less on how the programme sounds.
6.6 Discussion
Through our evaluation study, we achieved our aim of understanding how the radio production workflow was affected by our paper interface, compared to a screen interface. We also gained further insights into how the accuracy of ASR transcripts affect the editing process, and how listening is used to complement or replace semantic editing. We discuss each of these topics below.
6.6.1 Paper vs screen
We found that there were no overall preferences between the paper and screen interfaces, but that there were advantages and disadvantages of both in different uses and circumstances. Influential factors included the complexity of the edit, familiarity with the audio, accuracy of the transcript, user location and collaboration. Broadly speaking, we found that our pen interface was better for making simple edits involving quick decisions, using familiar content with a high-quality transcript, for producers working away from their desk, or with others in the same room. By contrast, we found that our screen interface was better suited to more complicated editing involving complex decisions, using less familiar content with a lower accuracy transcript, for producers working at their desk, or with other people remotely.
Participants reported that using paper rather than a screen made it it easier to read transcripts, remember information, think widely and orientate themselves. This aligns with previous research that has compared reading on paper to screens (O’Hara and Sellen 1997; And, Kurniawan, and Zaphiris 2001; Mangen, Walgermo, and Brønnick 2013; Singer and Alexander 2017). These results show that the benefits of paper-based working can translate to radio production using ASR transcripts.
On average, editing using the pen interface was 16% faster than using the screen, but this result was not statistically significant. However, three of the participants reported that they could edit faster and more easily using the pen interface compared to the screen. This may have been partially due to the faster reading speed of paper and the ability to underline while reading or listening. Some participants also suggested that the lack of integrated playback and correction features may have caused them to focus more on the task at hand, rather than being distracted by correction or navigation.
The screen interface included integrated playback and correction, which made it a more powerful tool. P7 reported that this made it suitable for more challenging editing tasks or exploring less familiar content, where the producer needs to be able to listen and navigate efficiently. The integrated listening also made it better for working with less familiar or lower accuracy transcripts as participants could tolerate the errors by using their memory of what was said, by listening or by correcting the errors. The screen makes it easier to listen and correct the errors, so is a better choice for editing less familiar content or lower quality transcript.
Three participants reported that both interfaces lacked features for labelling or re-ordering material, which meant that they were only currently suitable for creating a rough edit. This limits the usefulness of semantic editing in the later stages of production. For the pen interface, handwriting recognition could be used to label a specified region, or the nearest selected content. Two participants requested that the labels should be included in the exported EDL, so that they integrate with their existing tools.
Half of the participants reported that they like to work away from their desk or office as it helps them to focus. Pen and paper is naturally very portable and can be used almost anywhere. As it is does not use a screen, it is smaller, lighter, easier on the eyes and has a longer battery life. Several participants reported that this makes it more suitable for travel, and would allow them to work in more comfortable places. However, the requirement to print the transcripts makes it unsuitable for working “on the road”, where new material is recorded outside the office. By using a laptop or tablet device, the screen interface is also portable. The screen has the advantage of integrated playback and correction, and could be used on the road as it doesn’t need a printer.
Producers do not work alone and need to collaborate with others during production. The physical nature of paper made the digital pen interface suitable for working with others in the same room, as it allowed them to spatially arrange the pages and refer to the transcript by pointing. However, it is not possible for the pen interface to be used remotely. The digital nature of the screen interface makes it easy to work with remote collaborators. There is also potential to extend the screen interface to use operational transformation (Sun et al. 2004), which would allow multiple users to edit the same content simultaneously.
Our choice of technology for implementing the pen interface introduced some constraints that affected our design. Users edited the content by underlining or striking text within a set of rectangular boxes. These gestures were interpreted literally, which created a potential source of errors, and forced the participants to draw carefully. This design also prevented us from including correction and undo features. The batch-mode operation of the digital pen also prevented us from including integrated playback. By overcoming the constraints of our implementation, a pen interface with integrated listening, correction and undo could allow users to combine the benefits of working with paper with the full feature-set of the screen interface. However, there is also a risk that adding more features to the pen interface could introduce distractions, as we saw with the screen interface.
Electronic paper may provide a technical solution that could bypass these constraints. At the time we developed our pen interface, there were no e-paper devices that supported digital ink interaction, but these will become available in the near future. For example, the reMarkable tablethttps://remarkable.com/
is an e-paper device that includes a digital ink interface. Although e-paper displays do not seem to currently perform as well as paper for reading speed, comprehension or eye fatigue (Jeong 2012; Daniel and Woody 2013), they are likely to improve over time and may provide a good middle-ground between paper and screen interfaces.
6.6.2 ASR transcripts
The accuracy of a transcript has a direct effect on the performance and usage of semantic editing tools. We identified five different areas that were affected by transcript accuracy: correction, reading speed, reliance on listening, transcript longevity and edit granularity.
Three participants reported that errors in the transcripts slowed down their reading speed, with some errors being more distracting than others. Clearly, the more errors that occur, the more likely it is that corrections will be needed. However, the majority of participants were only interested in correcting errors that were particularly distracting. None of the participants needed or wanted to fully correct the transcripts, as this is only required if the transcript needs to be published. Although publication of transcripts is not currently part of the production workflow, doing so would make the programmes more easily discoverable and searchable.
The ASR system we used often mistranscribed unknown words into a variety of different words, which prevented the use of search-and-replace. This usually occurred with words specific to the programme, such as names of contributors or locations. To avoid this, producers could add unknown words to the dictionary of the ASR system prior to transcription. By providing additional contextual information, such as the programme topic or number of speakers, the ASR system could improve the transcript accuracy by using this to better calculate the likelihood of certain words occurring or by limiting the number of unique speaker segments.
The participants in our study using listening and memory to tolerate errors in the transcript. Remembering what was originally said increased the readability of the transcript and reduced the need to replay the audio. One participant reported that transcripts are often retained to help producers search through previously recorded material. However, as the producer’s memory fades, the errors in the transcript of previously recorded material become more of a problem, and the usefulness of the transcript deteriorates over time.
One participant reported that they selected more material than they needed due to the number of errors in the transcript. This suggests that the accuracy of the transcript may affect edit granularity. Selecting too much material creates more work for the producer at a later stage, as they have to edit their programme down to a specific time.
Two participants showed an interest in using semantic editing to remove “umm”s and breaths. The ASR systems we used were designed to ignore these sort of noises, rather than transcribe them. When they did appear, they were transcribed into a variety of words, which made it difficult to find and remove them. By explicitly including “umm”s and breaths in the ASR training data, these noises could be highlighted in the transcript, which could give users the option to remove them automatically.
6.6.3 Listening
We found in Chapter 5 that listening was an important part of the editing process. Through our study, we learned more about how and why the participants listened to the audio for semantic speech editing. Participants gave three main reasons for listening — processing information, judging sound quality and identifying non-speech sounds.
Listening allowed participants to hear what the transcript could not tell them, such as identifying mistakes or omissions in the transcript, finding where there are environmental sounds and working out whether the quality of the speech is sufficiently good for inclusion in their programme. Two participants said that simultaneously reading and listening made it easier to process the information in the speech, making the edit process more efficient. This falls in line with previous findings that providing transcripts allows users to process voicemail messages more efficiently (Whittaker et al. 2002), and improves the comprehension of time-compressed audio (Vemuri et al. 2004).
Half of the participants reported that they sometimes edit audio without a transcript, as they can remember most of what was said, and when it was said, for audio recordings less than 15–25 minutes long. For some programmes that focus on the auditory experience, editorial decisions will be led by the quality of the sound rather than what was said. In these cases, the cost and overhead of generating a transcript may not be worthwhile, however, it is unclear exactly where this threshold lies.
Two participants reported that they like to re-listen to their recordings in full to refresh their memory and start making decisions on what to use for their programme. Another participant suggested that the current process of manual transcription gave them an opportunity to re-listen. Re-listening in full adds overhead to the editing process, but some participants considered it to be a worthwhile process. The introduction of ASR transcription removes this opportunity. There is a risk that semantic editing may cause producers to base their decisions on transcripts rather than audio, which may affect the quality of the programme.
Listening is an important part of editing, but it is a time-consuming process. This could be reduced by using time compression techniques to increase the playback speed, as discussed in Section 2.5.1, or using sound event detection to identify and label regions of environmental noise (Duan et al. 2014; Kroos and Plumbley 2017). Including this information in the transcript could help producers identify sounds they do or do not want. Producers may also benefit from tools that help them see which edits would work or not. For example, a graphical representation of the intonation of speech may help producers identify whether editing two pieces of speech together would sound acceptable.
6.7 Conclusion
We presented the results of a contextual user study of semantic speech editing in professional radio production that compared a digital pen interface to a screen-based interface. We found that the pen and screen interfaces both work well, but that each is better in different situations.
The benefits of reading from paper and the simplicity of the pen interface made it better for fast, simple editing with familiar audio and accurate transcripts. The integrated listening and correction features of the screen interface made it better for more complex editing with less familiar audio and less accurate transcripts. Unlike the pen, the screen interface is capable of remote collaboration, but the pen interface may work better when working with others face-to-face. The digital pen provides greater flexibility for working away from the desk, but its dependence on printing makes it difficult to work on the road. The lack of re-ordering and labelling features in both systems prevented them from being used beyond rough edit stage.
The accuracy of transcripts is crucial to success of both systems. Lower accuracy transcripts appear to result in more correction, slower reading speed, more reliance on listening, a shorter transcript “shelf-life” and selecting more audio than necessary. The accuracy could be improved by using programme-specific information in the ASR process. Listening is an important part of the editing process, with some producers choosing to re-listen to recordings in full. Listening is used to process information, judge quality and identify non-speech sounds. Transcripts may not be needed for short recordings or where the auditory experience, rather than the specific speech content, is particularly important.
7 Conclusions and further work
The aim of this research was to “improve radio production by developing and evaluating methods for interacting with, and manipulating, recorded audio” (Section 1.2). We focused our research on pre-production of speech content by professional radio producers to make the most of the access available to us from working within the BBC. In fulfilment of our aim, the primary contribution of this thesis has been the development and evaluation of three methods for editing speech recordings through audio visualization, semantic speech editing and a digital pen interface. We developed these methods based on genuine requirements gathered from radio producers and evaluated them in the workplace to ensure that our methods and results were relevant to real-life application.
To conclude this thesis, we first discuss our approach, results and contributions in Section 7.1, where we also reflect upon some of the tensions we observed between reading transcripts and listening, and between paper and screen interfaces. In Section 7.2, we describe potential options for further work, including follow-up research resulting from our studies, as well as some broader applications of semantic audio production tools. Finally, in Section 7.3 we summarise the novelties and achievements of this work, and answer our research questions.
7.1 Discussion
We began our research by conducting three ethnographic case studies in BBC Radio to learn more about real-life radio production practice. We used the results to develop theoretical models of production workflows for a news bulletin, drama and documentary. We developed these based on direct observation of actual practice, which gave us insights into the genuine processes and challenges of radio production. In addition to the workplace studies in Chapter 3, we deepened our understanding of existing production workflows through interviews with twelve radio producers as part of the user studies in Chapters 5 and 6. These models and insights contribute to the academic understanding of radio production practice. The results of this ethnographic work highlighted three directions for research involving audio visualization, textual representation of speech, and the use of paper. We then investigated each of these through technical intervention.
7.1.1 Semantic audio visualization
Our initial investigation looked at using pseudocolour to visualize a semantic audio feature to support audio editing using waveforms. We measured the user performance for a simple editing task using our semantic audio visualization, compared to a normal waveform. The results showed that when using the semantic audio waveform, the participants completed the task faster, with less effort and with greater accuracy than the normal waveform. This suggests that there is value in the pseudocolour approach to semantic audio visualization taken by Rice (2005), Akkermans et al. (2011) and J. Loviscach (2011a), which had previously been untested.
Our experiment only focused on a single task of segmenting music from speech so there are many opportunities for applications beyond the task we chose. Audio visualizations can either be designed for specific tasks, or for general use to cover a range of tasks. Visualizations that focus on an individual task may produce better results, but are only suitable for that task. Designing a general audio visualization is much more challenging, but has the potential to create a greater impact as it could be used for a variety of applications.
The semantic audio visualization we designed and tested used a rudimentary semantic audio feature rather than the state-of-the-art. We did not attempt to create the best possible visualization as we wanted there to be an element of human judgement in the measured task. There is potential to make better visualizations by including more and better semantic audio features, and using more advanced methods of visualization. For example, the false colour approach taken by Tzanetakis and Cook (2000) and Mason, Evans, and Sheikh (2007) allowed multiple features to be displayed simultaneously in a human-readable way.
Although we found that users required less effort to complete the task with a normal waveform than without, they did not complete the task significantly faster nor more accurately. We found this surprising as waveforms are widely used in audio editing software, so it was expected that waveforms would improve the performance of users in completing audio editing tasks. This poor performance is concerning as the widespread use of audio waveforms means that this affects a large community. However, this finding highlights an opportunity to increase the efficiency of audio production software by making improvements to the waveform visualization.
7.1.2 Semantic speech editing
We conducted two user studies in which semantic speech editing was successfully used by professional radio producers to create real radio programmes that were subsequently broadcast. Our results support previous work in finding that semantic speech interfaces help users navigate and edit speech (Whittaker et al. 2002), and that semantic editing is faster than, and preferable to, using audio waveforms (Whittaker and Amento 2004; Sivaraman, Yoon, and Mitros 2016). Our research went further by conducting user evaluations in a natural working environment, and directly comparing semantic speech editing to the existing editing workflow. This allowed us to gain insights into its limitations in the context of radio production.
Our semantic speech editor was similar to the system described by Rubin et al. (2013). However, rather than using verbatim transcripts, which are slow and expensive to produce, we used automatic speech recognition (ASR). The high speed and low cost of ASR make it better suited for use in broadcast environments, but the erroneous transcripts it produces affect the usability of semantic editing. Crucially, we discovered that the quality of modern ASR systems was sufficient to allow for semantic speech editing in radio production. This aligns with similar findings for the semantic editing of voice messages (Whittaker and Amento 2004; Sivaraman, Yoon, and Mitros 2016). Our studies also revealed that the accuracy of the transcript affected the need for correction, reading speed, reliance on listening, longevity of the transcript and the edit granularity.
The producers we tested reported that they only found semantic editing useful for creating a “rough edit”, where large segments of audio are selected from the original material. This contradicts findings by Sivaraman, Yoon, and Mitros (2016) for the editing of voice messages. We found that the main reason for this limitation was the lack of annotation and re-ordering features, which made it difficult for producers to organise, structure and arrange their material in the later stages. However, this limitation was not an obstruction to the producers we tested, as our semantic speech editing tools integrated with several digital audio workstations (DAWs), which allowed the producers to seamlessly transition to their normal tools to complete their production.
We tested a variety of additional features to support semantic editing, including transcript correction and confidence shading. We found that many of the transcript errors encountered were specific to the programme content, such as names and topic-specific words. However, most producers were only interested in correcting errors that were particularly distracting. Most producers we tested found confidence shading to be useful overall, which supports Burke, Amento, and Isenhour (2006), but contradicts Suhm, Myers, and Waibel (2001) and Vemuri et al. (2004).
DAWs are powerful, feature-rich tools, but to novice users they can be intimidating to work with. Yoon et al. (2014; Sivaraman, Yoon, and Mitros 2016) found that semantic speech editing tools are easier to use and more accessible than waveform-based tools. Podcasting has already democratised the distribution of audio content, and semantic speech editing may have the potential to achieve something similar for audio production. This would allow more people to access audio production, which could hopefully lead to the production of more and better audio content.
Alternative methods of interacting with audio content may also give rise to new creative opportunities for more innovative programme making. For example, the comedy duo known as “Cassetteboy” (Perraudin 2014) patiently trawl through hours of video footage to re-order the words of famous speeches in amusing ways. This could be achieved much more easily using a semantic speech editor.
The efficiency savings from using semantic speech editing tools and ASR could provide cost and time savings over traditional editing and manual transcription. This should free up time and budget for more valuable production activities, which may lead to improvements in the quality of programmes and/or reduction in the cost of production.
7.1.3 Reading vs listening
Transcripts display the words that were spoken in a recording, but much of the content’s true meaning is hidden in the audio. Although transcripts show what was said, they do not reveal how it was said, which is crucial when producing radio programmes. As one producer pointed out, “radio is made with your ears”.
The only way to fully comprehend audio recordings is through listening. We found that radio producers used listening to process information, judge the quality of the sound and identify non-speech sounds. Some producers reported that reading and listening at the same time enabled them to comprehend information more easily, supporting the findings from Vemuri et al. (2004). Producers listened to identify any low quality audio, such as “umm”s and “err”s, and long or heavy breaths. These are visible in verbatim transcripts, as used by Berthouzoz, Li, and Agrawala (2012) and Rubin et al. (2013), but are not included in ASR transcripts. Producers also listened to identify any high quality moments that may not be identifiable using the transcript, and non-speech sounds that they might want to include or exclude in their programme.
The existing radio production workflow involves producers “logging” recordings by listening to the audio and typing rough quotes and labels. This process is time-consuming and tedious, but it helps the producer to review and organise their content. ASR transcription replaces this logging process, which saves producers time and effort. However, it also means that producers don’t have to listen to the audio before editing, which may prevent some producers from listening to the material before making editorial decisions. There is a risk that over-reliance on transcripts may result in missing out on good quality content or failing to avoid poor quality content, which would affect the overall programme quality.
Providing an easy way to listen to the audio underlying the transcript is important. Our screen-based semantic speech editor included integrated playback, which allowed users to navigate the audio using the text. Time compression, such as described in Section 2.6, would also allow producers to listen faster, and producers valued this feature when we added it to our screen-based editor. Reading the transcript while listening also increases the speed at which time-compressed audio can be comprehended (Vemuri et al. 2004).
However, we found that in some situations, transcripts are not necessary or useful. With recordings shorter than 15-25 mins, producers reported that they can remember what was said, and when it was said. Some programmes have a greater focus on the sound design, which limits the value of a transcript.
We saw that transcripts of radio programmes are not normally published at the BBC, as they are not written during the programme’s production. ASR and transcript correction tools could make it possible for producers to create a verbatim transcript as part of their production process. Publishing these could allow audio content to be more easily searchable and discoverable through Internet search engines, for example. Word-level timings could also be used to link directly to segments of audio. For example, NPR’s online clipping tool “Shortcut” (Friedhoff 2016) allows radio listeners to create a short clip from a radio programme and share it with their friends.
7.1.4 Paper vs screen
Our ethnographic case studies in Chapter 3 identified that many radio producers work on paper. Our user study in Chapter 5 also found that many producers want to be able to work away from their screens. This led us to develop a novel semantic speech editing system that used digital pens to allow producers to edit speech recordings using a paper transcript. We conducted a qualitative user study with professional radio producers that compared our paper interface to a screen-based semantic speech editor. The results of our study provide insights into the relative benefits of editing speech on paper compared to screens. We found that both the paper and screen interfaces worked well, but that each had advantages and disadvantages in different contexts.
Overall, we found that the paper interface was better suited to quick and simple edits where listening is not as critical, such as with high accuracy transcripts, or very recent recordings. Our screen-based semantic speech editor included integrated playback and correction features, which made it better for more complex editing with less familiar audio and less accurate transcripts.
Producers reported that paper transcripts were easier to read and remember, and made it easier for them to think widely and orientate themselves. They reported that our digital pen interface was simple, intuitive, precise and allowed edit decisions to be made quickly and easily. However, producers had concerns over the cost of an additional device which would likely have to be shared amongst a team, and could easily be lost.
The physical nature of the digital pen and paper made it better suited to travel and working away from the desk. This gives producers greater flexibility to work in more comfortable locations and while commuting. However the digital pen interface uses considerable amounts of paper, involves carrying the pen around, and requires access to a colour laser printer, which would make it difficult to work “on the road”. The screen interface could be used on a laptop or tablet, which have the added benefit of integrated playback. However, screens are heavier, bulkier and have a much shorter battery life than digital pens.
Radio is usually produced by a team, so tools that facilitate collaboration are valuable in such an environment. We found that the physical nature and pagination of paper made it better suited to face-to-face collaboration than the screen. However, the screen interface is capable of remote collaboration, and could be used over the Internet for real-time collaborative speech editing.
The limitations of the digital pen system we used prevented us from including features for integrated playback, correction and undo. The lack of integrated playback forced producers to replay and navigate audio using a separate device, which made it more challenging to identify errors in the transcript. This was a bigger issue with low quality transcripts, which could also not be corrected using the digital pen. The integrated playback of the screen interface made it easier for the participants to find and fix mistakes in the transcript. This also made it easier to edit content that required more listening, such as old or unfamiliar recordings.
7.2 Further work
Further work that could follow on from the research of this thesis includes:
Collaborative semantic speech interaction: The semantic speech editing systems we developed in this thesis were designed to be operated by individuals. However, as shown in Chapter 3, radio production involves teams of people. Collaborative tools may help these teams work together more efficiently. Operational transformation techniques (Sun et al. 2004) have enabled the development of collaborative document editing tools, such as the popular Google Docs, which can facilitate concurrent team-based working. For example, Fisher (2016) describes how NPR used Google Docs to enable over a dozen producers to collaboratively fact-check the US Presidential Election debates live, using real-time ASR transcripts. By linking the text to audio, a similar approach could be used for collaborative semantic editing of speech. Teams could also use annotation to make suggestions for edits that are then accepted or rejected by the programme producer.
Assisted/automatic de-umming: In Section 3.2.3, we saw that a large proportion of a studio manager’s time was spent on cleaning-up interview material by removing unwanted vocal noises, known as “de-umming”. Examples of unwanted noises include “umm”s and “err”s, long or loud breaths, and redundant phrases, such as “you know”. These can be difficult to identify, as their presence is not clearly visible using current tools, and they can be difficult to remove as they often overlap and blend with the clean speech. Loviscach (2013) demonstrated a prototype “umm detector” that extracted MFCC features (see Section 2.2.1.3) from the audio and used template matching to visually highlight potential “umm”s. We could not find any other work that attempted to detect or remove unwanted speech noises.
One solution could be to train an ASR system to “transcribe” unwanted sounds. These “words” could then be highlighted, or removed in the same way that transcripts can be semantically edited. However, this assumes that these noises have clearly defined boundaries, which they often do not. In the author’s experience, de-umming involves a level of editorial and creative judgement, so a “human in the loop” system may be necessary.
Improved automatic speech recognition: In this thesis, we found that the transcripts produced by current ASR systems were sufficiently accurate to perform semantic speech editing in professional radio production. However, as discussed in Section 2.4.1, ASR quality affects comprehension, search, and the need for correction, so it is desirable to improve the transcript accuracy. Prior to transcription, much is already known about the content of the speech, and by providing this information to the ASR system in advance, it could be used to improve the quality of the transcript. For example, the topic of conversation could be used to weight the likelihood of words related to that topic to appear. Many ASR systems have a speaker diarization pre-processing stage, and the number, gender and identity of speakers could also be used to improve the accuracy of this process.
Improved digital pen system: The design of our digital pen semantic speech editor in Chapter 6 was influenced by the technical limitations of the technology that we used to implement it. This prevented us from including certain features such as integrated listening and correction, and was inflexible in interpreting the user’s gestures. These issues could be avoided by using a different system for implementation.
The digital pen we used operated in “batch mode” as it connected to the computer using a USB dock. This prevented us from integrating control over the playback of the audio. A digital pen with a wireless link could allow a user to play, pause and navigate the audio using the paper transcript. The design of our paper layout used strict rectangular boundaries to capture edit commands, which created a potential source of errors. By using a more flexible approach, the system may be able to better understand the user’s intentions and avoid inadvertent mistakes. Additionally, the ability to distinguish between edit commands and handwriting could allow the user to both edit and correct the transcript on paper.
Penless paper editor: In Chapter 6, we based the design of our system on a digital pen as it combined the readability of real paper with the digital capture of freehand annotations. However, when we evaluated the system, some producers were concerned about losing the pen, having to share it and its cost. Several producers said they would prefer to use a highlighter or different coloured ink, which digital pens do not support. There are also patents that cover digital pens (Fåhraeus 2003), which can make development more difficult.
Scanners and cameras could be used as alternative methods of digitally capturing freehand annotations from paper. For example, a barcode or QR code could be used to label each page with a unique identity that links to a stored image of the printed page. The stored image could be used to mask the picture, or scan of the paper, leaving only the user’s annotations. Image analysis could then be used to interpret the user’s annotations and translate them into edits, corrections and labels.
Rich audio visualization: In Chapter 4, we showed that speech/music segmentation can be performed faster, more easily and more accurately by using pseudocolour to map a semantic audio scalar feature to a colour gradient. Previous systems from Tzanetakis and Cook (2000) and Mason, Evans, and Sheikh (2007) have also showed how false colour can be used to map multiple features to colour space. Onomatopoeia is the formation of words that resemble the sound they describe. The author believes that there is significant untapped potential to design an onomatopoeic audio visualization that “looks like it sounds”. Such a visualization could provide an efficient and accessible way of navigating all types of audio content.
Crossmodal correspondences could be exploited when designing the mapping between semantic audio features and visual properties. Many of the links listed in Table 2.3.1.1 have yet to be tested for visually navigating audio content, and previous work on audio visualization has mostly focused on colour. Other visual properties such as shape and texture could be used to increase the richness of the information presented in the image. For example, textures can be generated using procedural techniques (Ebert et al. 2002), which would allow them to be synthesised from semantic audio features. However, selecting the best combination of semantic audio features and visual mappings is a huge challenge, and is likely to be different for each application.
Application to television The focus of research in this thesis has been solely on semantic audio tools for the production of radio. However, there may be opportunities to transfer some of the tools and findings from this work to the production of television. The weekly reach and consumption figures for television (91%, 25 hours) are similar to that of radio (90%, 21 hours) (Office of Communications 2017, pp. 82-119). However, based on the author’s experience in working with BBC producers in both television and radio, there are big differences between the two in terms of team size, budget and culture. These differences may affect the relevance and performance of the tools.
Radio is often produced by small teams of between two and five. Television production involves dozens or sometimes hundreds of people, as demonstrated by the list of credits at the end of each programme. In 2016/17, the BBC spent £2.48B on television production — over five times the amount spent on radio production (Office of Communications 2017, pp. 39-111). There are also important cultural differences between television and radio production. For example, in the BBC, most radio producers are employed directly by the public service arm of the BBC as full-time staff. In television, most producers are freelancers working on short-term contracts, either for an independent company or a commercial arm of the BBC. It is currently unknown how these differences will affect the performance and usage of semantic production tools, so this may be an interesting direction for the research.
7.3 Summary
In this thesis, we investigated how semantic audio technology could be used to improve the radio production process. We began our research by conducting three ethnographic case studies of professional radio production. Based on our findings, we developed three semantic audio tools for radio production using semantic audio visualization, and semantic speech editing on screen and paper interfaces. By evaluating our tools, we answered the following four research questions:
How can radio production be improved with new technology for interacting with and manipulating recorded audio?
We found that radio production can be improved by using semantic audio visualization to add colour to audio waveforms, and using semantic speech editing to edit speech using text on both screen and paper interfaces.
What is the role and efficacy of audio visualisation in radio production?
We found that radio producers regularly use audio waveforms to navigate and edit audio content. We developed a simple semantic audio visualization for segmenting music and speech, and conducted the first formal study on the effect of audio waveforms and semantic audio visualization on user performance. We found that using our semantic audio visualization was faster, more accurate and required less effort than using a waveform. Using an audio waveform required less effort than no visualization, but was not significantly faster, nor more accurate.
How can transcripts of speech be adapted and applied to radio production?
We found that some radio producers use textual representations to navigate and edit audio content. We developed a semantic speech editing system that allowed radio producers to edit audio using text, and evaluated this approach with professional radio producers for the production of genuine programmes. The radio producers were successful in using semantic speech editing with ASR transcripts as part of their workflow, and continued to use our system after the study. Through our study, we also gained insights into the importance of annotation, collaboration, portability and listening.
What is the potential role of augmented paper in radio production?
We found that some radio producers use paper to make freehand annotations and facilitate face-to-face collaboration. We designed and developed a novel system for semantic speech editing on paper using a digital pen. We compared our paper interface to a screen interface and normal paper through a user study of professional radio producers. We found that the benefits of reading from paper and the simplicity of the pen interface made it better for fast, simple editing with familiar audio and accurate transcripts. The integrated listening and correction features of the screen interface made it better for more complex editing with less familiar audio and less accurate transcripts. We also gained insights into effect of ASR accuracy, the role of listening, and the relative benefits of paper and screen interfaces for collaboration and portability.
We have shown that semantic audio production tools can benefit professional radio producers, but they could also be adapted to make audio production more accessible to the wider public. This could empower many more people to use audio production as a medium for self-expression, benefiting society as a whole.
A. Software implementation
As part of the research presented in this thesis, we developed several systems for semantic speech editing and audio visualization. We have since published these systems as open-source software for others to use. This chapter outlines the technical details behind the implementation of these systems, including notes on how we approached the more challenging technical aspects of system design.
A.1 Dialogger
Dialogger is a semantic audio and video editor that enables the navigation and editing of media recordings using a text-based interface. The design and operation of Dialogger is outlined in Section 6.3.2. We have published the system as open-source software under an Apache 2.0 licence at the following URL: https://github.com/bbc/dialogger
Dialogger includes features for playback, navigation and editing of media using a transcript, export of edit decision lists (EDLs), user accounts and media asset management. Our system does not include an ASR system, media transcoder or media file export, however these can easily be integrated using the instructions in the user guide.
A.1.1 System overview
The structure and data flow of Dialogger is shown in Figure A.1.1.1. We divided our system into a presentation layer (front end) and a data management layer (back end). The front end used HTML, CSS and Javascript so that the system could be accessed through a web browser. We used Semantic UI as a user interface framework, Backbone as a model-view-controller framework and Dropzone to handle file uploads.

For the back end, we used Node.js and Express as our framework, and MongoDB for our database. We authenticated users using Passport.js, logged errors using Bunyan and used Mimovie to extract metadata from uploaded media files.
A.1.2 Word processing
We included word processing functionality in Dialogger to allow users to navigate the speech, correct mistakes in the transcript and mark up edit decisions. We used the CKEditorhttps://ckeditor.com/
library as the basis for the word processing functionality in our interface.
Timestamps In addition to the requirements of a normal word processor, our system had a unique requirement for each word to include a hidden timestamp, and for that timestamp to be retained throughout the editing process. We achieved this by using HTML formatting to add a tag to each word, and including the start and end timestamps as attributes of the tag. This linked the words to timestamps, but certain edit actions created problems, as explained below.
Split words Traditional word processors allow users to select text with the granularity of individual characters. This caused an issue where words could be split by cutting, moving or replacing only part of a word. To avoid this problem, we restricted editing to word level-granularity by automatically moving the user’s selections to the start and end of words.
Joined words Occasionally, ASR systems will transcribe a single word as two or more words. When the user corrects this by selecting both words and typing a replacement, then both words are replaced and their timestamps are lost. To avoid this, we added logic that detected this behaviour and created a new word with the start time of the first selected word and the end time of the last selected word.
Re-ordering Word processing gives users the freedom to move and edit words as they wish. However, when text is moved around it becomes very difficult for the user to keep track of the original location and order of the words. This is a problem with audio editing as some edits sound unacceptable, so users will often want to adjust the edit. Our solution was to retain the sequence of the words so that they stay in their original positions. This prevented re-ordering of the words, however, this could later be adjusted using a DAW. We implemented this restriction by disabling cut, copy, paste and drag-and-drop.
A.1.3 Media integration
We used timestamps to link each word in the transcript to a segment of a media file. To integrate the transcript edits with the media, we built systems to generate an edit decisions list (EDL) based on the user’s annotations, to instantly preview those edits in the browser, and to allow the user to download a copy of the final edit.
EDL generation In addition to including the start and end timestamp of each word in a HTML tag, we included the timestamp of the next word in the transcript. To detect edit points, we simply looked for any difference in the predicted and actual timestamp of the next word. We could then generate an EDL by filtering words based on their annotation, then looking for edit points. However, this approach relies on the words being in their original sequence. Our EDL format is simply an array of timestamps that denote the in-points and out-points of each edit.
Preview We wanted users to be able to preview their edits to quickly hear whether the edits sound acceptable or not. When a user uploads their media, we transcode a low-bitrate “preview copy” of the file, which we then use for live playback in the browser. To control the playback, we used HTML5 Video Compositorhttps://github.com/bbc/html5-video-compositor
— a media composition engine that can play edit decision lists in the browser. After the user makes an edit, we generate an EDL, convert it to the correct format, and pass it to the compositor, which dynamically adjusts the playback of the preview copy. To avoid the browser having to download the entire file before playback, we used byte serving to dynamically send only the portion of the preview copy that is needed.
Export Once the user has completed their production, they can export their edit as either a rendered media file, or an EDL file for a DAW. The EDL of the user’s edits is sent from the browser to the back end. Media is rendered and transcoded using the MLT Multimedia Frameworkhttps://www.mltframework.org/
that supports sample-accurate editing of audio and video files. To maximise the quality of the exported media, we use the original assets when rendering the file. To generate the EDL files for DAWs, we simply convert our internal EDL format into (AES31–3 2008) or another proprietary format.
A.2 Vampeyer
As part of this research, we wanted to generate audio visualizations based on extracted semantic audio features. There are already many software packages that visualize audio, and audio features, in a variety of ways, most notably Sonic Visualiser (Cannam, Landone, and Sandler 2010). However, the visualization algorithms are hard-coded into the software, making prototyping of new methods difficult. We developed a software plugin system for visualizing audio as a bitmap image. We have published this system as open-source software under an Apache 2.0 licence at the following URL: https://github.com/bbc/vampeyer
A.2.1 Design
We built our plugin system on top of the well-known Vamp audio analysis plugin systemhttp://vamp-plugins.org/
, to make use of the current large collection of audio feature extraction plugins. An outline of the
design of Vampeyer is shown in Figure A.2.1.1. We designed our plugin system to receive the output of one or more Vamp plugins as the input, and send a bitmap image as the output.

A Vampeyer plugin defines which Vamp plugin(s) it requires, including the block/step size and parameters. At least one Vamp plugin is required, but there is no restriction of the number of Vamp plugins that can be used. Both frameworks are written in C++ which allows for efficient processing. This is important when processing large collections, or generating visualizations “on-the-fly”. Vampeyer plugins are compiled into shared libraries, so they can be distributed without users having to re-compile locally and be integrated into third-party software.
A.2.2 Implementation
To illustrate the design and operation of Vampeyer plugins, we describe the data structures and functions that are used to convert the Vamp plugin output into an image. The following five data structures define how data should be sent and returned from the plugin’s functions.
VampParameteris a name/value pair used to store a parameterVampParameterListis a vector ofVampParametersVampPluginstores the name of a Vamp plugin along with a
VampParameterListand the preferred block and step sizesVampOutputstores aVampPluginand output nameVampOutputListis a vector ofVampOutputs
Vampeyer plugins have two primary functions to describe the required input audio features, and then process those features into a bitmap image.
getVampPluginsreturns aVampOutputListvariable that contains a list of Vamp plugin outputs which must be provided as inputARGBtakes the Vamp plugin output data as aVamp::FeatureSetvariable, plus the sample rate of the audio and the desired width and height of the bitmap. It returns a bitmap image formatted in 32-bit ARGB format (alpha, red, green, blue).
Vampeyer plugins need to be run by a host program which reads the audio data, processes it using the Vamp plugins, generates the image using the Vampeyer plugin and then writes the image data. We have published such a program as a command-line tool that can either display the image in a window or write it to disk as a PNG file. This makes it useful for both prototyping and for back-end processing on a server, for example.
We have also published a number of example plugins to demonstrate the capabilities of Vampeyer, and to act as useful pieces of software in their own right. These include plugins for an audio waveform, a waveform colourised by low energy ratio (see Section 4.1.4), a waveform colourised by spectral centroid (similar to Akkermans et al. (2011)) and an MFCC visualization.
A.3 BeatMap
To display and utilise our audio visualizations in a user interface, we wanted to use them in a web browser for navigating and editing audio. We could not find any software libraries that allowed us to display bitmap images that were linked to audio, so we developed BeatMap — a Javascript user interface library for displaying audio visualization bitmaps. Figure A.3.1 shows an example user interface that uses BeatMap to display a pre-rendered waveform visualization. We published the BeatMap library as open-source software under a GNU General Public License v3.0 at the following URL: https://github.com/bbc/beatmap
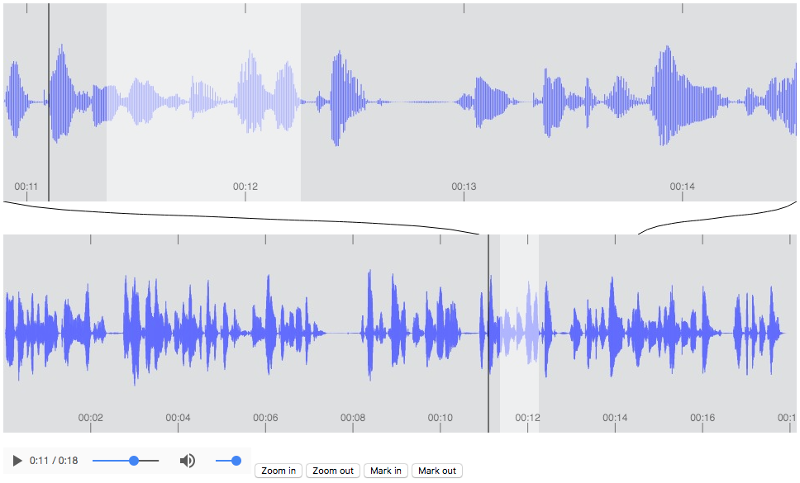
A.3.1 Design
We came across two challenges when designing BeatMap. Firstly, bitmap images of long audio files can be very large, which makes it impractical for use over the web. Secondly, audio visualizations need to be able to zoom horizontally so that users can view the visualization at different scales and levels of detail.
Tiling To bypass the problem of large image files, we designed BeatMap to use tiled bitmap images. This breaks the audio visualization into many individual chunks, so that only the portion of the image currently being viewed needs to be downloaded. Initial testing found that when playing, tiles were not being loaded in time, so we added a pre-loading function that predicts which tiles will be displayed next and downloads them in advance.
Zoom We added a horizontal zoom function to allow audio visualizations to be viewed at different scales. We achieved this by using multiple images, one for each scale, and allowing the user to switch between them. In addition to changing zoom level within the main display, we added support for a linked secondary display that can view the same audio visualization at a different zoom level (see Figure A.3.1). This enables users to simultaneously view the entire audio recording at once, while also being able to see the visualization of the current playback position in greater detail.
Bibliography
Adobe Systems Inc. 2016. “Let’s Get Experimental: Behind the Adobe MAX Sneaks.” https://theblog.adobe.com/lets-get-experimental-behind-the-adobe-max-sneaks/.
AES31–3. 2008. Audio Engineering Society.
Akkermans, V., F. Font, J. Funollet, B. de Jong, G. Roma, S. Togias, and X. Serra. 2011. “Freesound 2: An Improved Platform for Sharing Audio Clips.” In Proceedings of the 12th International Society for Music Information Retrieval Conference (Ismir). Miami, Florida, USA.
And, Sri Kurniawan, Sri H. Kurniawan, and Panayiotis Zaphiris. 2001. “Reading Online or on Paper: Which Is Faster?” In Proceedings of the 9th International Conference on Human Computer Interaction, 5–10.
Anguera Miro, X., S. Bozonnet, N. Evans, C. Fredouille, G. Friedland, and O. Vinyals. 2012. “Speaker Diarization: A Review of Recent Research.” IEEE Transactions on Audio, Speech, and Language Processing 20 (2):356–70. https://doi.org/10.1109/TASL.2011.2125954.
Annett, John, and Neville Anthony Stanton. 2000. “Task Analysis.” In, 150–69. CRC Press.
Apperley, Mark, Orion Edwards, Sam Jansen, Masood Masoodian, Sam McKoy, Bill Rogers, Tony Voyle, and David Ware. 2002. “Application of Imperfect Speech Recognition to Navigation and Editing of Audio Documents.” In Proceedings of the Sigchi-Nz Symposium on Computer-Human Interaction, 97–102. CHINZ ’02. New York, NY, USA: ACM. https://doi.org/10.1145/2181216.2181233.
Arawjo, Ian, Dongwook Yoon, and François Guimbretière. 2017. “TypeTalker: A Speech Synthesis-Based Multi-Modal Commenting System.” In Proceedings of the 2017 Acm Conference on Computer Supported Cooperative Work and Social Computing, 1970–81. CSCW ’17. Portland, Oregon, USA: ACM. https://doi.org/10.1145/2998181.2998260.
Arons, Barry. 1992. “A Review of the Cocktail Party Effect.” Journal of the American Voice I/O Society 12:35–50.
———. 1997. “SpeechSkimmer: A System for Interactively Skimming Recorded Speech.” ACM Trans. Comput.-Hum. Interact. 4 (1). New York, NY, USA: ACM:3–38. https://doi.org/10.1145/244754.244758.
Ask Audio. 2015. “The Top 11 Most Popular Daws (You Voted for).” https://ask.audio/articles/the-top-11-most-popular-daws-you-voted-for.
Avid Technology Inc. 2011. User Manual: “Getting Started with ScriptSync”. http://resources.avid.com/SupportFiles/attach/GettingStartedScriptSync_v6.pdf.
———. 2017. “Media Composer: ScriptSync Option.” http://www.avid.com/products/media-composer-scriptsync-option.
Barbour, Jim. 2004. “Analytic Listening: A Case Study of Radio Production.” In Proc. International Conference on Auditory Display. Sydney, Australia. http://www.icad.org/websiteV2.0/Conferences/ICAD2004/papers/barbour.pdf.
BBC. 2015. “History of the Bbc Factsheets.” http://www.bbc.co.uk/historyofthebbc/resources/fact-sheets.
———. 2017. “Annual Report and Accounts 2016/17.” http://downloads.bbc.co.uk/aboutthebbc/insidethebbc/reports/pdf/bbc-annualreport-201617.pdf.
BBC Charter. 2016. “Royal Charter for the Continuance of the British Broadcasting Corporation.” http://downloads.bbc.co.uk/bbctrust/assets/files/pdf/about/how_we_govern/2016/charter.pdf.
BBC News. 2013. “Queen Officially Opens BBC’s New Broadcasting House Building.” http://www.bbc.com/news/uk-22804844.
Bell, P., M. J. F. Gales, T. Hain, J. Kilgour, P. Lanchantin, X. Liu, A. McParland, et al. 2015. “The Mgb Challenge: Evaluating Multi-Genre Broadcast Media Recognition.” In Proc. IEEE Workshop on Automatic Speech Recognition and Understanding (Asru), 687–93. https://doi.org/10.1109/ASRU.2015.7404863.
Bendel, Oliver. 2017. “The Synthetization of Human Voices.” AI & SOCIETY, July. https://doi.org/10.1007/s00146-017-0748-x.
Berthouzoz, Floraine, Wilmot Li, and Maneesh Agrawala. 2012. “Tools for Placing Cuts and Transitions in Interview Video.” ACM Trans. Graph. 31 (4). New York, NY, USA: ACM:67:1–67:8. https://doi.org/10.1145/2185520.2185563.
Boas, Mark. 2011. “Blog Post: ‘The Hyperaudio Pad - A Software Product Proposal’.” http://happyworm.com/blog/2011/08/08/the-hyperaudio-pad-a-software-product-proposal/.
Boháč, Marek, and Karel Blavka. 2013. “Text-to-Speech Alignment for Imperfect Transcriptions.” In Text, Speech, and Dialogue, 8082:536–43. Lecture Notes in Computer Science. Springer. https://doi.org/10.1007/978-3-642-40585-3_67.
Bouamrane, Matt-M., and Saturnino Luz. 2007. “Meeting Browsing.” Multimedia Systems 12 (4-5). Springer-Verlag:439–57. https://doi.org/10.1007/s00530-006-0066-5.
Braun, Virginia, and Victoria Clarke. 2006. “Using Thematic Analysis in Psychology.” Qualitative Research in Psychology 3 (2):77–101. https://doi.org/10.1191/1478088706qp063oa.
Brixen, Eddy B. 2003. “Audio Production in Large Office Environments.” In Proc. 115th Audio Engineering Society Convention. http://www.aes.org/e-lib/browse.cfm?elib=12467.
Brooke, John. 1996. “Usability Evaluation in Industry.” In Usability Evaluation in Industry, 189–206. Taylor & Francis.
Burke, Moira, Brian Amento, and Philip Isenhour. 2006. “Error Correction of Voicemail Transcripts in Scanmail.” In Proc. SIGCHI Conference on Human Factors in Computing Systems, 339–48. CHI ’06. Montréal, Québec, Canada: ACM. https://doi.org/10.1145/1124772.1124823.
Cabral, Diogo, and Nuno Correia. 2016. “Video Editing with Pen-Based Technology.” Multimedia Tools and Applications, 1–26. https://doi.org/10.1007/s11042-016-3329-y.
Cannam, C., C. Landone, and M. Sandler. 2010. “Sonic Visualiser: An Open Source Application for Viewing, Analysing, and Annotating Music Audio Files.” In Proceedings of the Acm Multimedia 2010 International Conference, 1467–8. Firenze, Italy.
Carey, M.J., E.S. Parris, and H. Lloyd-Thomas. 1999. “A Comparison of Features for Speech, Music Discrimination.” In Proc. IEEE International Conference on Acoustics, Speech, and Signal Processing, 1:149–52 vol.1. https://doi.org/10.1109/ICASSP.1999.758084.
Casares, Juan, A. Chris Long, Brad A. Myers, Rishi Bhatnagar, Scott M. Stevens, Laura Dabbish, Dan Yocum, and Albert Corbett. 2002. “Simplifying Video Editing Using Metadata.” In Proceedings of the 4th Conference on Designing Interactive Systems: Processes, Practices, Methods, and Techniques, 157–66. DIS ’02. London, England: ACM. https://doi.org/10.1145/778712.778737.
Cattelan, Renan G., Cesar Teixeira, Rudinei Goularte, and Maria Da Graça C. Pimentel. 2008. “Watch-and-Comment as a Paradigm Toward Ubiquitous Interactive Video Editing.” ACM Trans. Multimedia Comput. Commun. Appl. 4 (4). New York, NY, USA: ACM:28:1–28:24. https://doi.org/10.1145/1412196.1412201.
Conroy, Kevin, Dave Levin, and François Guimbretière. 2004. “ProofRite: A Paper-Augmented Word Processor.” In Proc. ACM Symposium on User Interface Software and Technology.
Cridford, Alan. 2005. “Inside Track: SpotOn.” Line Up 1 (99):34–35. https://ips.org.uk/wp-content/uploads/2016/02/LU099-10-SpotOn.pdf.
Daniel, David B., and William Douglas Woody. 2013. “E-Textbooks at What Cost? Performance and Use of Electronic Versus Print Texts.” Computers & Education 62:18–23. https://doi.org/10.1016/j.compedu.2012.10.016.
Davis, Fred D. 1989. “Perceived Usefulness, Perceived Ease of Use, and User Acceptance of Information Technology.” MIS Quarterly 13 (3). Management Information Systems Research Center, University of Minnesota:319–40. https://doi.org/10.2307/249008.
Derry, Roger. 2003. PC Audio Editing, Second Edition. Taylor & Francis.
Dewey, Christopher, and Jonathan P. Wakefield. 2014. “A Guide to the Design and Evaluation of New User Interfaces for the Audio Industry.” In Proc. Audio Engineering Society Convention. http://www.aes.org/e-lib/browse.cfm?elib=17218.
Diakopoulos, Nicholas, and Irfan Essa. 2006. “Videotater: An Approach for Pen-Based Digital Video Segmentation and Tagging.” In Proceedings of the 19th Annual Acm Symposium on User Interface Software and Technology, 221–24. UIST ’06. Montreux, Switzerland: ACM. https://doi.org/10.1145/1166253.1166287.
Doddington, G.R. 1985. “Speaker Recognition: Identifying People by Their Voices.” Proceedings of the IEEE 73 (11):1651–64. https://doi.org/10.1109/PROC.1985.13345.
Downie, J. Stephen. 2008. “The Music Information Retrieval Evaluation Exchange (2005–2007): A Window into Music Information Retrieval Research.” Acoustical Science and Technology 29 (4):247–55. https://doi.org/10.1250/ast.29.247.
Duan, Shufei, Jinglan Zhang, Paul Roe, and Michael Towsey. 2014. “A Survey of Tagging Techniques for Music, Speech and Environmental Sound.” Artificial Intelligence Review 42 (4):637–61. https://doi.org/10.1007/s10462-012-9362-y.
Dunaway, David King. 2000. “Digital Radio Production - Towards an Aesthetic.” New Media and Society 2 (1). SAGE Publications:29–50.
Ebert, David S., F. Kenton Musgrave, Darwyn Peachey, Ken Perlin, and Steven Worley. 2002. Texturing and Modeling - a Procedural Approach. Edited by David S. Ebert. Academic Press.
Ericsson, Lars. 2009. “Automatic Speech/Music Discrimination in Audio Files.” Master’s thesis, School of Media Technology, KTH Royal Institute of Technology. http://www.speech.kth.se/prod/publications/files/3437.pdf.
Erol, Berna, Emilio Antúnez, and Jonathan J. Hull. 2008. “HOTPAPER: Multimedia Interaction with Paper Using Mobile Phones.” In Proceedings of the 16th Acm International Conference on Multimedia, 399–408. MM ’08. Vancouver, British Columbia, Canada: ACM. https://doi.org/10.1145/1459359.1459413.
Erol, Berna, Jamey Graham, Jonathan J. Hull, and Peter E. Hart. 2007. “A Modern Day Video Flip-Book: Creating a Printable Representation from Time-Based Media.” In Proceedings of the 15th Acm International Conference on Multimedia, 819–22. MM ’07. Augsburg, Germany: ACM. https://doi.org/10.1145/1291233.1291419.
Fazekas, György. 2012. “Semantic Audio Analysis Utilities and Applications.” PhD thesis, Queen Mary University of London. http://qmro.qmul.ac.uk/jspui/handle/123456789/8443.
Fazekas, György, and Mark Sandler. 2007. “Intelligent Editing of Studio Recordings with the Help of Automatic Music Structure Extraction.” In 122nd Audio Engineering Society Convention. http://www.aes.org/e-lib/browse.cfm?elib=14024.
Fåhraeus, C. 2003. Recording of information. US 6502756, issued 2003. https://www.google.com/patents/US6502756.
Feng, Jinjuan, and Andrew Sears. 2004. “Using Confidence Scores to Improve Hands-Free Speech Based Navigation in Continuous Dictation Systems.” ACM Trans. Comput.-Hum. Interact. 11 (4). New York, NY, USA: ACM:329–56. https://doi.org/10.1145/1035575.1035576.
Fisher, Tyler. 2016. “How Npr Transcribes and Fact-Checks the Debates, Live.” https://source.opennews.org/articles/how-npr-transcribes-and-fact-checks-debates-live/.
Foote, Jonathan. 1999. “An Overview of Audio Information Retrieval.” Multimedia Systems 7 (1). Springer-Verlag:2–10.
Foulke, Emerson, and Thomas G. Sticht. 1969. “Review of Research on the Intelligibility and Comprehension of Accelerated Speech.” Psychological Bulletin 72 (1):50–62. https://doi.org/10.1037/h0027575.
Fouse, Adam, Nadir Weibel, Edwin Hutchins, and James D. Hollan. 2011. “ChronoViz: A System for Supporting Navigation of Time-Coded Data.” In Proc. Extended Abstracts on Human Factors in Computing Systems (Chi), 299–304. CHI Ea ’11. Vancouver, British Columbia, Canada: ACM. https://doi.org/10.1145/1979742.1979706.
Friedhoff, Jane. 2016. “Notes on Designing This American Life’s ‘Shortcut’.” The Tow Center for Digital Journalism. https://towcenter.org/notes-from-creating-this-american-lifes-shortcut/.
Friedland, G., O. Vinyals, Yan Huang, and C. Muller. 2009. “Prosodic and Other Long-Term Features for Speaker Diarization.” Trans. Audio, Speech and Lang. Proc. 17 (5). Piscataway, NJ, USA: IEEE Press:985–93. https://doi.org/10.1109/TASL.2009.2015089.
Gohlke, Kristian, Michael Hlatky, Sebastian Heise, David Black, and Jörn Loviscach. 2010. “Track Displays in DAW Software: Beyond Waveform Views.” In Proc. 128th Audio Engineering Society Convention. Audio Engineering Society. http://www.aes.org/e-lib/browse.cfm?elib=15441.
Goodwin, M.M., and J. Laroche. 2004. “A Dynamic Programming Approach to Audio Segmentation and Speech/Music Discrimination.” In Proc. IEEE International Conference on Acoustics, Speech, and Signal Processing (Icassp)., 4:iv–309–iv–312vol.4. https://doi.org/10.1109/ICASSP.2004.1326825.
Goudeseune, Camille. 2012. “Effective Browsing of Long Audio Recordings.” In Proceedings of the 2nd Acm International Workshop on Interactive Multimedia on Mobile and Portable Devices, 35–42. IMMPD ’12. Nara, Japan: ACM. https://doi.org/10.1145/2390821.2390831.
Gravano, A., M. Jansche, and M. Bacchiani. 2009. “Restoring Punctuation and Capitalization in Transcribed Speech.” In 2009 Ieee International Conference on Acoustics, Speech and Signal Processing, 4741–4. https://doi.org/10.1109/ICASSP.2009.4960690.
Griggs, Kenneth King. 2007. “Transcript Alignment.” Google Patents. https://www.google.com/patents/US7231351.
Gueorguieva, R., and J. H. Krystal. 2004. “Move over ANOVA: Progress in Analyzing Repeated-Measures Data and Its Reflection in Papers Published in the Archives of General Psychiatry.” Archives of General Psychiatry 61 (3):310–17. https://doi.org/10.1001/archpsyc.61.3.310.
Guimbretière, François. 2003. “Paper Augmented Digital Documents.” In Proceedings of the 16th Annual Acm Symposium on User Interface Software and Technology, 51–60. UIST ’03. Vancouver, British Columbia, Canada: ACM. https://doi.org/10.1145/964696.964702.
Hart, Sandra G. 2006. “NASA-Task Load Index (Nasa-Tlx); 20 Years Later.” In Proceedings of the Human Factors and Ergonomic Society Annual Meeting, 50:904–8. 9. Sage. https://doi.org/10.1177/154193120605000909.
Hart, Sandra G., and Lowell E. Staveland. 1988. “Development of NASA-TLX (Task Load Index): Results of Empirical and Theoretical Research.” In Human Mental Workload, 52:139–83. Advances in Psychology. North-Holland. https://doi.org/10.1016/S0166-4115(08)62386-9.
Hausman, C., F. Messere, L. O’Donnell, and P. Benoit. 2012. Modern Radio Production: Production Programming & Performance. Cengage Learning.
Hines, Mark. 2008. The Story of Broadcasting House. Merrell.
Hirschberg, Julia, and Barbara Grosz. 1992. “Intonational Features of Local and Global Discourse Structure.” In Proceedings of the Workshop on Speech and Natural Language, 441–46. HLT ’91. Stroudsburg, PA, USA: Association for Computational Linguistics. https://doi.org/10.3115/1075527.1075632.
Hori, C., and S. Furui. 2003. “A New Approach to Automatic Speech Summarization.” Trans. Multi. 5 (3). Piscataway, NJ, USA: IEEE Press:368–78. https://doi.org/10.1109/TMM.2003.813274.
Horner, Christopher Demetri. 1993. “NewsTime - a Graphical User Interface to Audio News.” Master’s thesis, Massachusetts Institute of Technology. http://hdl.handle.net/1721.1/45747.
Huang, Ronggui. 2016. “RQDA: R-Based Qualitative Data Analysis. R Package Version 0.2-8.”
Hull, J. J., B. Erol, J. Graham, and Dar-Shyang Lee. 2003. “Visualizing Multimedia Content on Paper Documents: Components of Key Frame Selection for Video Paper.” In Proc. Seventh International Conference on Document Analysis and Recognition, 389–92 vol.1. https://doi.org/10.1109/ICDAR.2003.1227695.
Hürst, Wolfgang, and Georg Götz. 2008. “Interface Designs for Pen-Based Mobile Video Browsing.” In Proceedings of the 7th Acm Conference on Designing Interactive Systems, 395–404. DIS ’08. Cape Town, South Africa: ACM. https://doi.org/10.1145/1394445.1394488.
Hyperaudio Inc. 2016. “Hyperaudio Pad: A Transcript Powered Audio and Video Editor.” http://hyperaud.io/.
Imai, S. 1983. “Cepstral Analysis Synthesis on the Mel Frequency Scale.” In ICASSP ’83. IEEE International Conference on Acoustics, Speech, and Signal Processing, 8:93–96. https://doi.org/10.1109/ICASSP.1983.1172250.
Ingebretsen, Robert B., and Thomas G. Stockham Jr. 1982. “Random Access Editing of Digital Audio.” In Proc. 72nd Audio Engineering Society Convention. http://www.aes.org/e-lib/browse.cfm?elib=11833.
Jeong, Hanho. 2012. “A Comparison of the Influence of Electronic Books and Paper Books on Reading Comprehension, Eye Fatigue, and Perception.” The Electronic Library 30 (3):390–408. https://doi.org/10.1108/02640471211241663.
Junqua, Jean-Claude, and Jean-Paul Haton. 1995. Robustness in Automatic Speech Recognition: Fundamentals and Applications. Kluwer Academic Publishers.
Kim, Jinmook, Douglas W. Oard, and Dagobert Soergel. 2003. “Searching Large Collections of Recorded Speech: A Preliminary Study.” Proceedings of the American Society for Information Science and Technology 40 (1). Wiley Subscription Services, Inc., A Wiley Company:330–39. https://doi.org/10.1002/meet.1450400141.
Kinnunen, Tomi, and Haizhou Li. 2010. “An Overview of Text-Independent Speaker Recognition: From Features to Supervectors.” Speech Communication 52 (1):12–40. https://doi.org/10.1016/j.specom.2009.08.009.
Kirwan, B., and L. K. Ainsworth. 1992. A Guide to Task Analysis: The Task Analysis Working Group. 1st ed. Paperback; Taylor & Francis.
Klemmer, Scott R., Jamey Graham, Gregory J. Wolff, and James A. Landay. 2003. “Books with Voices: Paper Transcripts as a Physical Interface to Oral Histories.” In Proceedings of the Sigchi Conference on Human Factors in Computing Systems, 89–96. CHI ’03. Ft. Lauderdale, Florida, USA: ACM. https://doi.org/10.1145/642611.642628.
Kobayashi, Minoru, and Chris Schmandt. 1997. “Dynamic Soundscape: Mapping Time to Space for Audio Browsing.” In Proceedings of the Acm Sigchi Conference on Human Factors in Computing Systems, 194–201. CHI ’97. Atlanta, Georgia, USA: ACM. https://doi.org/10.1145/258549.258702.
Köhler, W. 1929. Gestalt Psychology. Liveright.
Kroos, Christian, and Mark Plumbley. 2017. “Neuroevolution for Sound Event Detection in Real Life Audio: A Pilot Study.” In Proc. DCASE 2017. http://epubs.surrey.ac.uk/842496/.
Lee, Chin-Hui, Frank K. Soong, and Kuldip K. Paliwal. 1999. Automatic Speech and Speaker Recognition: Advanced Topics. Norwell, MA, USA: Kluwer Academic Publishers.
Liang, Bai, Hu Yaali, Lao Songyang, Chen Jianyun, and Wu Lingda. 2005. “Feature Analysis and Extraction for Audio Automatic Classification.” In Proc. IEEE International Conference on Systems, Man and Cybernetics, 1:767–72 Vol. 1. https://doi.org/10.1109/ICSMC.2005.1571239.
Liang, Yuan, Koji Iwano, and Koichi Shinoda. 2014. “Simple Gesture-Based Error Correction Interface for Smartphone Speech Recognition.” In Proc. Fifteenth Annual Conference of the International Speech Communication Association.
Lin, Kai-Hsiang, X. Zhuang, C. Goudeseune, S. King, M. Hasegawa-Johnson, and T. S. Huang. 2013. “Saliency-Maximized Audio Visualization and Efficient Audio-Visual Browsing for Faster-Than-Real-Time Human Acoustic Event Detection.” ACM Transactions on Applied Perception 10 (4). New York, NY, USA: ACM:26:1–26:16. https://doi.org/10.1145/2536764.2536773.
Lin, Kai-Hsiang, Xiaodan Zhuang, C. Goudeseune, S. King, M. Hasegawa-Johnson, and T.S. Huang. 2012. “Improving Faster-Than-Real-Time Human Acoustic Event Detection by Saliency-Maximized Audio Visualization.” In Proc. IEEE International Conference on Acoustics, Speech and Signal Processing, 2277–80. https://doi.org/10.1109/ICASSP.2012.6288368.
Long, A. Chris, Juan Casares, Brad A. Myers, Rishi Bhatnagar, Scott M. Stevens, Laura Dabbish, Dan Yocum, and Albert Corbett. 2003. “SILVER: Simplifying Video Editing with Metadata.” In CHI ’03 Extended Abstracts on Human Factors in Computing Systems, 628–29. CHI Ea ’03. Ft. Lauderdale, Florida, USA: ACM. https://doi.org/10.1145/765891.765898.
Loviscach, Jörn. 2011a. “A Nimble Video Editor That Puts Audio First.” In Proc. 131st Audio Engineering Society Convention. http://www.aes.org/e-lib/browse.cfm?elib=16023.
———. 2011b. “The Quintessence of a Waveform: Focus and Context for Audio Track Displays.” In Proc. 130th Audio Engineering Society Convention. Audio Engineering Society. http://www.aes.org/e-lib/browse.cfm?elib=15864.
———. 2013. “Semantic Analysis to Help Editing Recorded Speech.” http://www.j3l7h.de/talks/2013-05-04_Semantic_Analysis_to_Help_Editing_Recorded_Speech.pdf.
Luff, P., J. Hindmarsh, and C. Heath. 2000. Workplace Studies: Recovering Work Practice and Informing System Design. Cambridge University Press. https://doi.org/10.1017/CBO9780511628122.
Mangen, Anne, Bente R. Walgermo, and Kolbjørn Brønnick. 2013. “Reading Linear Texts on Paper Versus Computer Screen: Effects on Reading Comprehension.” International Journal of Educational Research 58:61–68. https://doi.org/10.1016/j.ijer.2012.12.002.
Mason, Andrew, Michael J. Evans, and Alia Sheikh. 2007. “Music Information Retrieval in Broadcasting: Some Visual Applications.” In Proc. 123rd Audio Engineering Society Convention. http://www.aes.org/e-lib/browse.cfm?elib=14296.
Masoodian, M., B. Rogers, D. Ware, and S. McKoy. 2006. “TRAED: Speech Audio Editing Using Imperfect Transcripts.” In Proc. 12th International Multi-Media Modelling Conference. https://doi.org/10.1109/MMMC.2006.1651371.
McLeish, Robert, and Jeff Link. 2015. Radio Production. Focal Press.
Moreland, Kenneth. 2009. “Diverging Color Maps for Scientific Visualization.” In Proceedings of the 5th International Symposium on Visual Computing. https://doi.org/10.1007/978-3-642-10520-3_9.
Morgan, Josh. 2015. “How Podcasts Have Changed in Ten Years: By the Numbers.” Medium. https://medium.com/@monarchjogs/how-podcasts-have-changed-in-ten-years-by-the-numbers-720a6e984e4e.
National Institute of Standards and Technology (NIST). 2016. “Rich Transcription Evaluation.” https://www.nist.gov/itl/iad/mig/rich-transcription-evaluation.
Nielsen, Jakob, and Thomas K. Landauer. 1993. “A Mathematical Model of the Finding of Usability Problems.” In Proc. INTERACT ’93 and Sigchi Conference on Human Factors in Computing Systems, 206–13. CHI ’93. Amsterdam, The Netherlands: ACM. https://doi.org/10.1145/169059.169166.
Noll, A. Michael. 1967. “Cepstrum Pitch Determination.” The Journal of the Acoustical Society of America 41 (293). https://doi.org/10.1121/1.1910339.
Office of Communications. 2017. “The Communications Market: UK.” https://www.ofcom.org.uk/research-and-data/multi-sector-research/cmr/cmr-2017/uk.
O’Hara, Kenton, and Abigail Sellen. 1997. “A Comparison of Reading Paper and on-Line Documents.” In Proceedings of the Acm Sigchi Conference on Human Factors in Computing Systems, 335–42. CHI ’97. Atlanta, Georgia, USA: ACM. https://doi.org/10.1145/258549.258787.
Panagiotakis, C., and G. Tziritas. 2005. “A Speech/Music Discriminator Based on RMS and Zero-Crossings.” IEEE Transactions on Multimedia 7 (1):155–66. https://doi.org/10.1109/TMM.2004.840604.
Patton, Michael Quinn. 1990. Qualitative Evaluation and Research Methods. Sage.
Perraudin, Frances. 2014. “Cassetteboy: ‘David Cameron Won’t Be Pleased by Our Video’.” The Guardian. https://www.theguardian.com/media/2014/oct/10/cassetteboy-david-cameron-mashup-copyright.
Peus, Stephan. 2011. “The ‘Digital Solution’: The Answer to a Lot of Challenges Within New Production Routines at Today’s Broadcasting Stations.” In Proc. 130th Audio Engineering Society Convention. http://www.aes.org/e-lib/browse.cfm?elib=15812.
Pikrakis, Aggelos, Theodoros Giannakopoulos, and Sergios Theodoridis. 2006. “A Computationally Efficient Speech/Music Discriminator for Radio Recordings.” In Proc. Of of the 7th International Conference on Music Information Retrieval, 107–10.
Pikrakis, A., T. Giannakopoulos, and S. Theodoridis. 2006. “Speech/Music Discrimination for Radio Broadcasts Using a Hybrid Hmm-Bayesian Network Architecture.” In Proceedings of the 14th European Signal Processing Conference. Florence, Italy.
———. 2008. “A Speech/Music Discriminator of Radio Recordings Based on Dynamic Programming and Bayesian Networks.” Multimedia, IEEE Transactions on 10 (5):846–57. https://doi.org/10.1109/TMM.2008.922870.
Pizzi, Skip. 1989. “Digital Audio Applications in Radio Broadcasting.” In Proc. Audio Engineering Society 7th International Conference on Audio in Digital Times. http://www.aes.org/e-lib/browse.cfm?elib=5446.
Producer Spot. 2015. “Top Ten Best Daw.” http://www.producerspot.com/top-best-daw-2015-best-music-software.
Raimond, Yves, Tristan Ferne, Michael Smethurst, and Gareth Adams. 2014. “The BBC World Service Archive Prototype.” Web Semantics: Science, Services and Agents on the World Wide Web 27-28 (0):2–9. https://doi.org/10.1016/j.websem.2014.07.005.
RAJAR. 2017. “Quarterly Summary of Radio Listening, Q3 2017.” http://www.rajar.co.uk/docs/2017_09/2017_Q3_Quarterly_Summary_Figures.pdf.
RAJAR, and IpsosMori. 2017. “MIDAS Audio Survey, Summer 2017.” http://www.rajar.co.uk/docs/news/MIDAS_Summer_v2.pdf.
Ramachandran, V.S., and E.M. Hubbard. 2001. “Synaesthesia - a Window into Perception, Thought and Language.” Journal of Consciousness Studies 8 (12):3–34.
Ramos, Gonzalo, and Ravin Balakrishnan. 2003. “Fluid Interaction Techniques for the Control and Annotation of Digital Video.” In Proceedings of the 16th Annual Acm Symposium on User Interface Software and Technology, 105–14. UIST ’03. Vancouver, British Columbia, Canada: ACM. https://doi.org/10.1145/964696.964708.
———. 2005. “Zliding: Fluid Zooming and Sliding for High Precision Parameter Manipulation.” In Proceedings of the 18th Annual Acm Symposium on User Interface Software and Technology, 143–52. UIST ’05. Seattle, Washington, USA: ACM. https://doi.org/10.1145/1095034.1095059.
Ranjan, Abhishek, Ravin Balakrishnan, and Mark Chignell. 2006. “Searching in Audio: The Utility of Transcripts, Dichotic Presentation, and Time-Compression.” In Proc. SIGCHI Conference on Human Factors in Computing Systems, 721–30. CHI ’06. Montréal, Québec, Canada: ACM. https://doi.org/10.1145/1124772.1124879.
Rice, Stephen V. 2005. “Frequency-Based Coloring of the Waveform Display to Facilitate Audio Editing and Retrieval.” In Proc. 119th Audio Engineering Society Convention. 119. New York, NY, USA.
Rice, S.V., and M.D. Patten. 2001. Waveform display utilizing frequency-based coloring and navigation. US 6184898B1, issued February 2001. https://patents.google.com/patent/US6184898B1/en
Rouanet, H., and D. Lépine. 1970. “Comparison Between Treatments in a Repeated-Measurement Design: ANOVA and Multivariate Methods.” British Journal of Mathematical and Statistical Psychology 23 (2). Blackwell Publishing Ltd:147–63. https://doi.org/10.1111/j.2044-8317.1970.tb00440.x.
Rubin, Steve, Floraine Berthouzoz, Gautham J. Mysore, Wilmot Li, and Maneesh Agrawala. 2013. “Content-Based Tools for Editing Audio Stories.” In Proceedings of the 26th Annual Acm Symposium on User Interface Software and Technology, 113–22. UIST ’13. St. Andrews, Scotland, United Kingdom: ACM. https://doi.org/10.1145/2501988.2501993.
Rubin, Steven. 2015. “Tools for Creating Audio Stories.” PhD thesis, Electrical Engineering; Computer Sciences, University of California at Berkeley. http://www2.eecs.berkeley.edu/Pubs/TechRpts/2015/EECS-2015-237.html.
Sailer, Martin Oliver. 2013. “crossdes: Construction of Crossover Designs.” R project package. https://cran.r-project.org/package=crossdes.
Saunders, J. 1996. “Real-Time Discrimination of Broadcast Speech/Music.” In Proc. IEEE International Conference on Acoustics, Speech, and Signal Processing (Icassp), 2:993–96 vol. 2. https://doi.org/10.1109/ICASSP.1996.543290.
Sauro, Jeff, and James R Lewis. 2016. Quantifying the User Experience: Practical Statistics for User Research. Morgan Kaufmann.
Schmandt, Chris, and Atty Mullins. 1995. “AudioStreamer: Exploiting Simultaneity for Listening.” In Conference Companion on Human Factors in Computing Systems, 218–19. CHI ’95. ACM. https://doi.org/10.1145/223355.223533.
Schubert, Emery, Joe Wolfe, and Alex Tarnopolsky. 2004. “Spectral Centroid and Timbre in Complex, Multiple Instrumental Textures.” In Proc. 8th International Conference on Music Perception & Cognition.
Sell, Gregory, and Pascal Clark. 2014. “Music Tonality Features for Speech/Music Discrimination.” In Proc. IEEE International Conference on Acoustic, Speech and Signal Processing (Icassp). https://doi.org/10.1109/ICASSP.2014.6854048.
Seyerlehner, Klaus, Tim Pohle, Markus Schedl, and Gerhard Widmer. 2007. “Automatic Music Detection in Television Productions.” In Proc. Of the 10th International Conference on Digital Audio Effects (Dafx). http://dafx.labri.fr/main/papers/p221.pdf.
Shalabh, Helge Toutenburg. 2009. Statistical Analysis of Designed Experiments, Third Edition. Springer. https://doi.org/10.1007/978-1-4419-1148-3.
Shin, Hijung Valentina, Wilmot Li, and Frédo Durand. 2016. “Dynamic Authoring of Audio with Linked Scripts.” In Proceedings of the 29th Annual Symposium on User Interface Software and Technology, 509–16. UIST ’16. Tokyo, Japan: ACM. https://doi.org/10.1145/2984511.2984561.
Singer, Lauren M., and Patricia A. Alexander. 2017. “Reading Across Mediums: Effects of Reading Digital and Print Texts on Comprehension and Calibration.” The Journal of Experimental Education 85 (1):155–72. https://doi.org/10.1080/00220973.2016.1143794.
Sivaraman, Venkatesh, Dongwook Yoon, and Piotr Mitros. 2016. “Simplified Audio Production in Asynchronous Voice-Based Discussions.” In Proceedings of the 2016 Chi Conference on Human Factors in Computing Systems, 1045–54. CHI ’16. Santa Clara, California, USA: ACM. https://doi.org/10.1145/2858036.2858416.
Smaragdis, Paris, Regunathan Radhakrishnan, and Kevin W. Wilson. 2009. “Context Extraction Through Audio Signal Analysis.” In Multimedia Content Analysis: Theory and Applications, edited by Ajay Divakaran, 1–34. Springer. https://doi.org/10.1007/978-0-387-76569-3_1.
Smith, Alvy Ray. 1978. “Color Gamut Transform Pairs.” SIGGRAPH Comput. Graph. 12 (3). New York, NY, USA: ACM:12–19. https://doi.org/10.1145/965139.807361.
Smith, Julius O., III. 2007. Mathematics of the Discrete Fourier Transform (DFT), with Audio Applications — Second Edition’. W3K Publishing. https://ccrma.stanford.edu/~jos/mdft/.
Spence, Charles. 2011. “Crossmodal Correspondences: A Tutorial Review.” Attention, Perception, & Psychophysics 73 (4):971–75. https://doi.org/10.3758/s13414-010-0073-7.
Stark, Litza, Steve Whittaker, and Julia Hirschberg. 2000. “ASR Satisficing: The Effects of ASR Accuracy on Speech Retrieval.” In Proc. Sixth International Conference on Spoken Language Processing. http://www.isca-speech.org/archive/archive_papers/icslp_2000/i00_3a69.pdf.
Stevens, S. S., and J. Volkmann. 1937. “A Scale for the Measurement of the Psychological Magnitude Pitch.” The Journal of the Acoustical Society of America 8 (185). https://doi.org/10.1121/1.1915893.
Suhm, Bernhard, Brad Myers, and Alex Waibel. 2001. “Multimodal Error Correction for Speech User Interfaces.” ACM Trans. Comput.-Hum. Interact. 8 (1). New York, NY, USA: ACM:60–98. https://doi.org/10.1145/371127.371166.
Sun, David, Steven Xia, Chengzheng Sun, and David Chen. 2004. “Operational Transformation for Collaborative Word Processing.” In Proceedings of the 2004 Acm Conference on Computer Supported Cooperative Work, 437–46. CSCW ’04. ACM. https://doi.org/10.1145/1031607.1031681.
Tranter, S.E., and D.A. Reynolds. 2006. “An Overview of Automatic Speaker Diarization Systems.” Audio, Speech, and Language Processing, IEEE Transactions on 14 (5):1557–65. https://doi.org/10.1109/TASL.2006.878256.
Truong, Anh, Floraine Berthouzoz, Wilmot Li, and Maneesh Agrawala. 2016. “QuickCut: An Interactive Tool for Editing Narrated Video.” In Proceedings of the 29th Annual Symposium on User Interface Software and Technology, 497–507. UIST ’16. Tokyo, Japan: ACM. https://doi.org/10.1145/2984511.2984569.
Tsiros, A. 2014. “Evaluating the Perceived Similarity Between Audio-Visual Features Using Corpus-Based Concatenative Synthesis.” In Proceedings of the Internation Conference on New Interfaces for Musical Expression. http://www.nime.org/proceedings/2014/nime2014_484.pdf.
Tucker, Simon, and Steve Whittaker. 2006. “Time Is of the Essence: An Evaluation of Temporal Compression Algorithms.” In Proceedings of the Sigchi Conference on Human Factors in Computing Systems, 329–38. CHI ’06. Montréal, Québec, Canada: ACM. https://doi.org/10.1145/1124772.1124822.
Tzanetakis, George, and Perry Cook. 2000. “Audio Information Retrieval (Air) Tools.” In Proc. International Society for Music Information Retrieval (Ismir). http://ismir2000.ismir.net/papers/tzanetakis_abs.pdf.
———. 2001. “MARSYAS3D: A Prototype Audio Browser-Editor Using a Large Scale Immersive Visual and Audio Display.” In Proceedings of the 2001 International Conference on Auditory Display, 250–54. Espoo, Finland. http://hdl.handle.net/1853/50625.
Vemuri, Sunil, Philip DeCamp, Walter Bender, and Chris Schmandt. 2004. “Improving Speech Playback Using Time-Compression and Speech Recognition.” In Proc. SIGCHI Conference on Human Factors in Computing Systems, 295–302. CHI ’04. Vienna, Austria: ACM. https://doi.org/10.1145/985692.985730.
Wald, Mike, John-Mark Bell, Philip Boulain, Karl Doody, and Jim Gerrard. 2007. “Correcting Automatic Speech Recognition Captioning Errors in Real Time.” International Journal of Speech Technology 10 (1). https://doi.org/10.1007/s10772-008-9014-4.
Weher, Karon, and Alex Poon. 1994. “Marquee: A Tool for Real-Time Video Logging.” In Proceedings of the Sigchi Conference on Human Factors in Computing Systems, 58–64. CHI ’94. Boston, MA, USA: ACM. https://doi.org/10.1145/191666.191697.
Weibel, Nadir, Adam Fouse, Colleen Emmenegger, Whitney Friedman, Edwin Hutchins, and James Hollan. 2012. “Digital Pen and Paper Practices in Observational Research.” In Proceedings of the Sigchi Conference on Human Factors in Computing Systems, 1331–40. CHI ’12. https://doi.org/10.1145/2207676.2208590.
Weibel, Nadir, Adriana Ispas, Beat Signer, and Moira C Norrie. 2008. “PaperProof: A Paper-Digital Proof-Editing System.” In CHI’08 Extended Abstracts on Human Factors in Computing Systems, 2349–54. ACM.
Whittaker, Steve, and Brian Amento. 2004. “Semantic Speech Editing.” In Proc. SIGCHI Conference on Human Factors in Computing Systems, 527–34. CHI ’04. Vienna, Austria: ACM. https://doi.org/10.1145/985692.985759.
Whittaker, Steve, and Julia Hirschberg. 2007. “Accessing Speech Data Using Strategic Fixation.” Computer Speech & Language 21 (2). Elsevier:296–324. https://doi.org/10.1016/j.csl.2006.06.004.
Whittaker, Steve, Julia Hirschberg, Brian Amento, Litza Stark, Michiel Bacchiani, Philip Isenhour, Larry Stead, Gary Zamchick, and Aaron Rosenberg. 2002. “SCANMail: A Voicemail Interface That Makes Speech Browsable, Readable and Searchable.” In Proc. SIGCHI Conference on Human Factors in Computing Systems, 275–82. CHI ’02. Minneapolis, Minnesota, USA: ACM. https://doi.org/10.1145/503376.503426.
Whittaker, Steve, Julia Hirschberg, John Choi, Don Hindle, Fernando Pereira, and Amit Singhal. 1999. “SCAN: Designing and Evaluating User Interfaces to Support Retrieval from Speech Archives.” In Proc. 22nd Annual International Acm Sigir Conference on Research and Development in Information Retrieval, 26–33. SIGIR ’99. Berkeley, California, USA: ACM. https://doi.org/10.1145/312624.312639.
Wieser, E., M. Husinsky, and M. Seidl. 2014. “Speech/Music Discrimination in a Large Database of Radio Broadcasts from the Wild.” In Proc. IEEE International Conference on Acoustics, Speech and Signal Processing (Icassp), 2134–8. https://doi.org/10.1109/ICASSP.2014.6853976.
Wilcox, Lynn D., Bill N. Schilit, and Nitin Sawhney. 1997. “Dynomite: A Dynamically Organized Ink and Audio Notebook.” In Proceedings of the Acm Sigchi Conference on Human Factors in Computing Systems, 186–93. CHI ’97. Atlanta, Georgia, USA. https://doi.org/10.1145/258549.258700.
Williams, E.J. 1949. “Experimental Designs Balanced for the Estimation of Residual Effects of Treatments.” Australian Journal of Scientific Research A Physical Sciences 2:149. https://doi.org/10.1071/PH490149.
Wolfe, J.M., and T.S. Horowitz. 2004. “What Attributes Guide the Deployment of Visual Attention and How Do They Do It?” Nature Reviews Neuroscience 5 (6):495–501. https://doi.org/10.1038/nrn1411.
Yoon, Dongwook, Nicholas Chen, François Guimbretière, and Abigail Sellen. 2014. “RichReview: Blending Ink, Speech, and Gesture to Support Collaborative Document Review.” In Proceedings of the 27th Annual Acm Symposium on User Interface Software and Technology, 481–90. UIST ’14. Honolulu, Hawaii, USA: ACM. https://doi.org/10.1145/2642918.2647390.
Yoon, Dongwook, Nicholas Chen, Bernie Randles, Amy Cheatle, Corinna E. Löckenhoff, Steven J. Jackson, Abigail Sellen, and François Guimbretière. 2016. “RichReview++: Deployment of a Collaborative Multi-Modal Annotation System for Instructor Feedback and Peer Discussion.” In Proceedings of the 19th Acm Conference on Computer-Supported Cooperative Work & Social Computing, 195–205. CSCW ’16. San Francisco, California, USA: ACM. https://doi.org/10.1145/2818048.2819951.
Zhang, Tony, and C. C. Jay Kuo. 2001. Content-Based Audio Classification and Retrieval for Audiovisual Data Parsing. Vol. 606. Springer. https://doi.org/10.1007/978-1-4757-3339-6.
Zue, Victor W., and Ronald A. Cole. 1979. “Experiments on Spectrogram Reading.” In Proc. IEEE International Conference on Acoustics, Speech, and Signal Processing (Icassp). https://doi.org/10.1109/ICASSP.1979.1170735.
Zue, V.W., and L. Lamel. 1986. “An Expert Spectrogram Reader: A Knowledge-Based Approach to Speech Recognition.” In Proc. IEEE International Conference on Acoustics, Speech, and Signal Processing (Icassp), 11:1197–1200. https://doi.org/10.1109/ICASSP.1986.1168798.